TGT Weekly Technical Analysis
Target Corporation
Large U.S. retail chain offering general merchandise, apparel, home goods, groceries, and essentials through 1,900+ stores and a strong omni-channel platform.
TGT Technical Analysis Summary
TGT has established a significant technical turnaround, breaking out of a large multi-year base and reclaiming the 200-week moving average. While short-term momentum indicators suggest a period of consolidation or minor pullback is occurring after the initial breakout surge, the underlying long-term structure has shifted to bullish. Maintaining price action above the 200-week SMA support zone will be critical to sustain the newly formed uptrend.
Included In Lists
Related Tickers of Interest
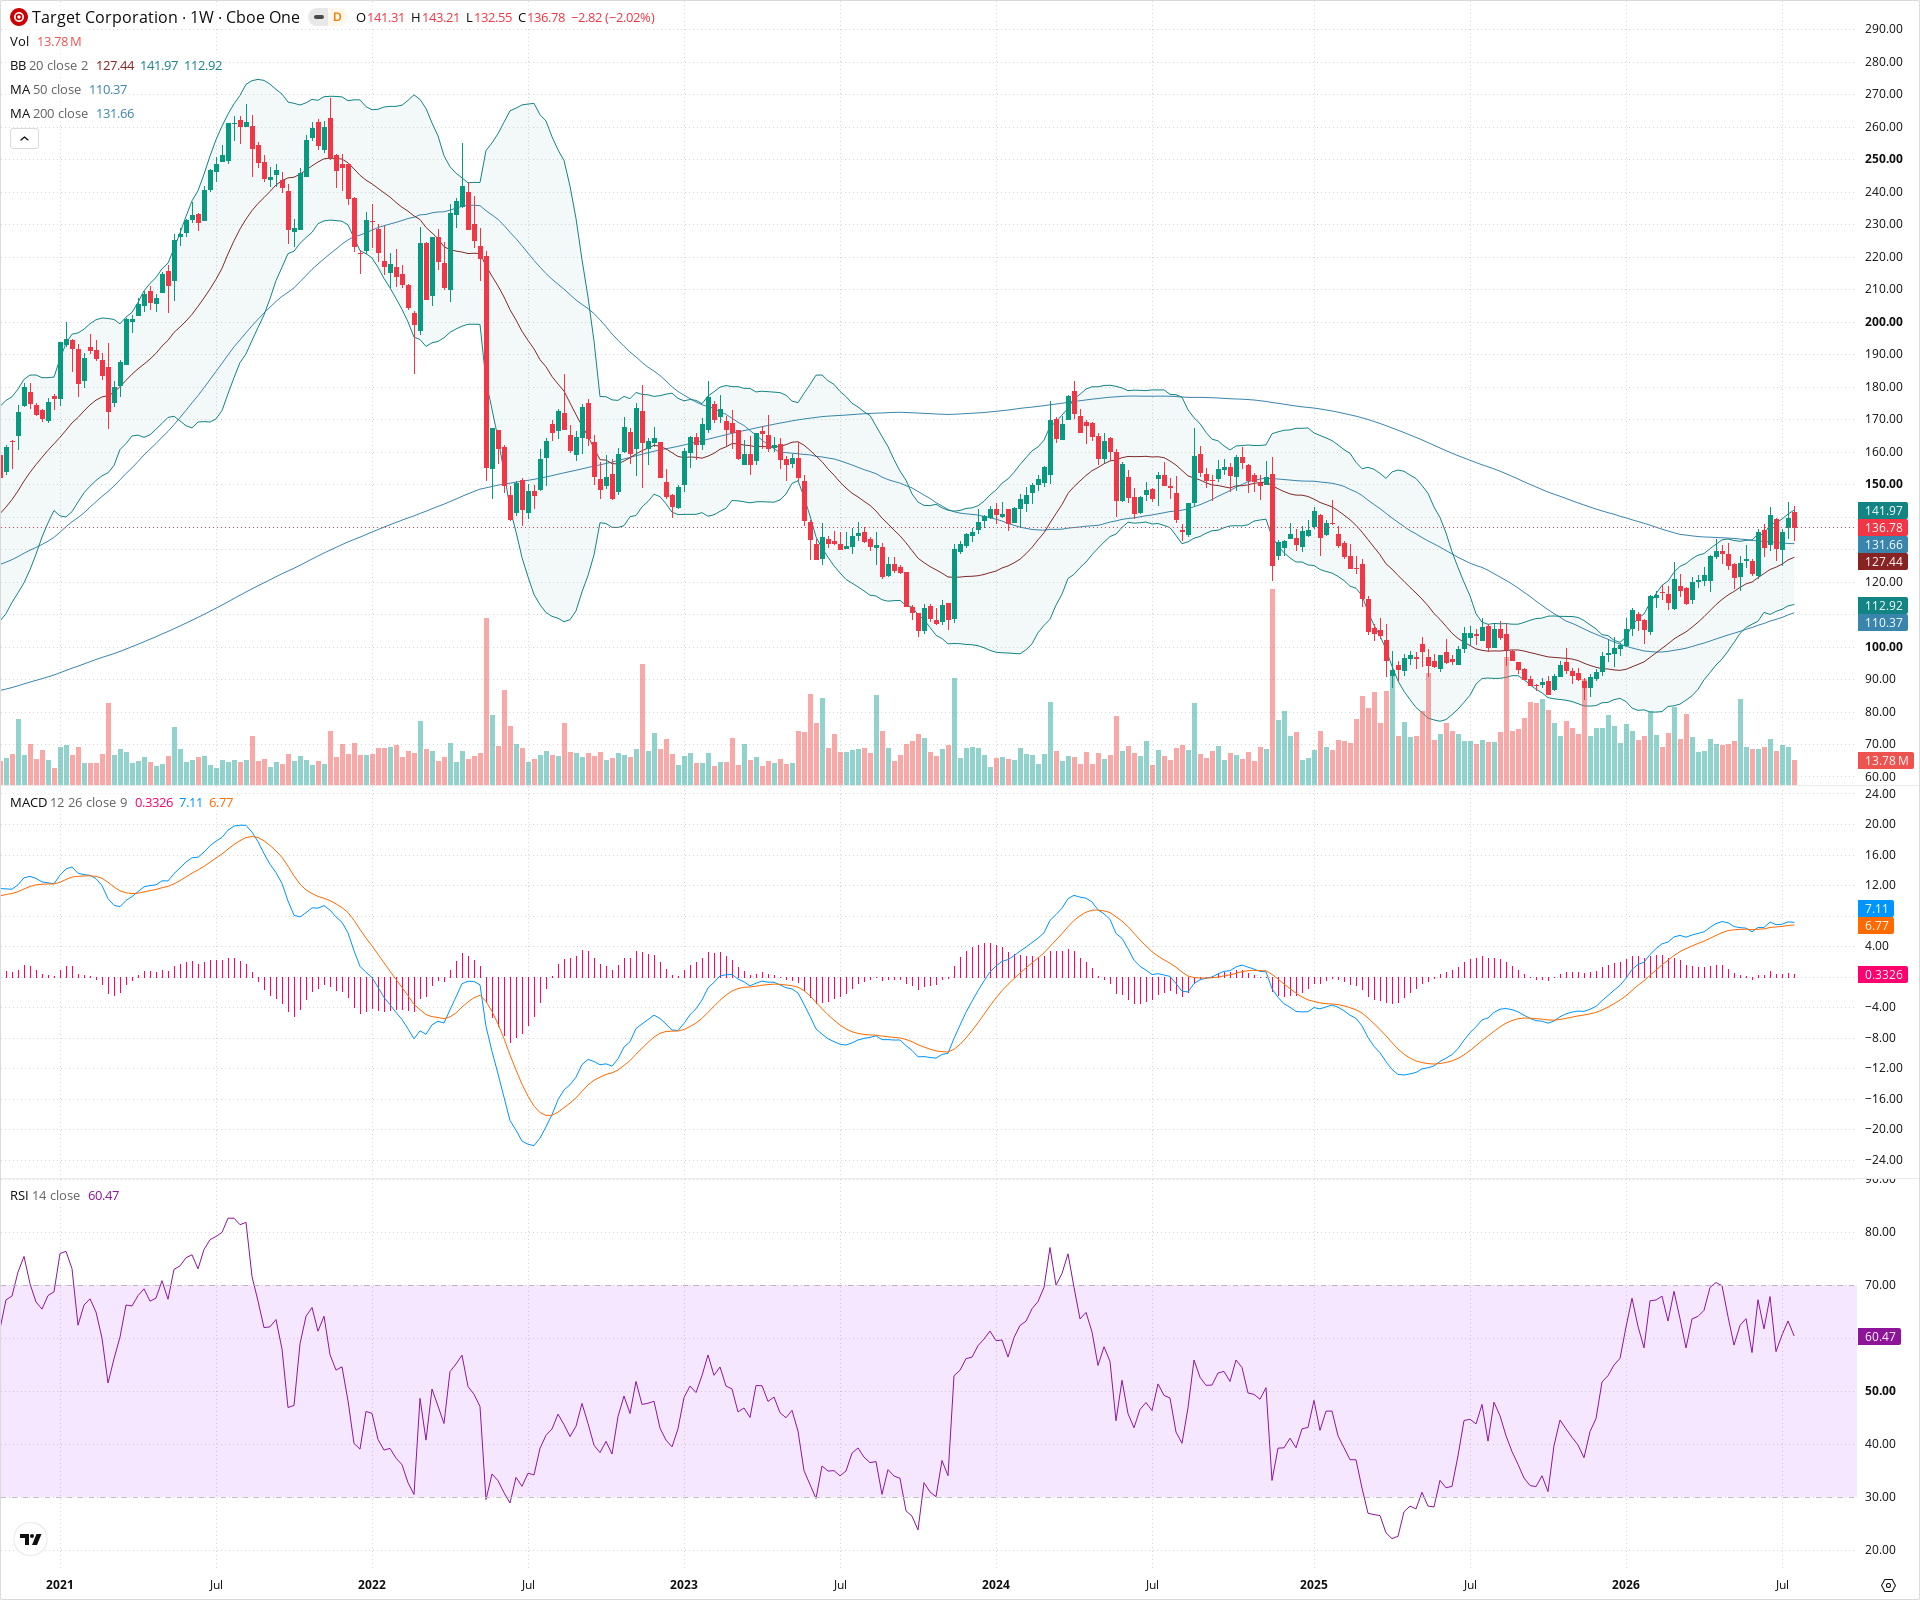
TGT Weekly Chart
Sentiment
Short-term Sentiment (days to weeks): Bullish
Price is holding above all major weekly moving averages (20, 50, 200) after a strong rally. Although RSI is retreating slightly from overbought territory and the MACD histogram is compressing, suggesting a near-term consolidation, the immediate trend remains upward.
Long-term Sentiment (weeks to months): Bullish
The chart shows a breakout from a massive multi-year base. Price has reclaimed the 200-week SMA, and the 50-week SMA has turned upward, indicating a structural long-term trend reversal from the prior bear market.
Report Metadata
- Timeframe: weekly
- Generated at: 2026-07-25T09:06:35.298Z
- Model: gemini-3.1-pro-preview
Support Price Levels
| Level | Range | Strength | Notes |
|---|---|---|---|
| $132.50 | $130.00 - $135.00 | Strong | Confluence of the 200-week SMA (currently near 131.66) and recent consolidation area just below the current price. |
| $110.00 | $105.00 - $115.00 | Strong | Major structural support zone encompassing the 50-week SMA and the area of prior significant swing lows that formed the bottom of the long-term base. |
Resistance Price Levels
| Level | Range | Strength | Notes |
|---|---|---|---|
| $146.50 | $143.00 - $150.00 | Moderate | Immediate resistance from the recent swing high (~143) extending into a historical congestion zone. |
| $175.00 | $170.00 - $180.00 | Strong | Major historical resistance zone characterized by previous structural peaks before the significant markdown phase in 2022. |
Potential Chart Patterns in Formation
| Strength | Pattern | Signal | Target | Details |
|---|---|---|---|---|
| Strong | Rounded Bottom / Long-term Base | Bullish | N/A | A massive, multi-year basing structure that formed between late 2022 and early 2024. The recent price action represents a breakout from this base, signaling a potential long-term trend change. |
Frequently Asked Questions about TGT
What is the current sentiment for TGT?
The short-term sentiment for TGT is currently Bullish because Price is holding above all major weekly moving averages (20, 50, 200) after a strong rally. Although RSI is retreating slightly from overbought territory and the MACD histogram is compressing, suggesting a near-term consolidation, the immediate trend remains upward.. The long-term trend is classified as Bullish.
What are the key support levels for TGT?
StockDips.AI has identified key support levels for TGT at $132.50 and $110.00. These levels may represent potential accumulation zones where buying interest could emerge.
Is TGT in a significant dip or a Value Dip right now?
TGT has a Value Score of 56/100. It is not currently flagged as a significant dip in the Top Dips list. It is not listed as a Value Dip because the long-term sentiment or value-score threshold does not qualify.
View the full interactive analysis on StockDips.AI.