ADA Daily Technical Analysis
Cardano
ADA is the native cryptocurrency of Cardano, a Proof-of-Stake (PoS) blockchain platform built for scalability, security, and sustainability, aiming to be a "next-gen" evolution of Ethereum for smart contracts and decentralized apps (dApps)
ADA Technical Analysis Summary
ADA remains in a severe long-term downtrend, characterized by price action well below a declining 200-day SMA. Following a high-volume capitulation event, the asset has entered a period of low-volatility sideways consolidation. Short-term momentum indicators like RSI and MACD are completely neutral, suggesting a pause in trend rather than a reversal. Until price can reclaim significant resistance levels, the overarching structure favors further downside continuation.
Included In Lists
Related Tickers of Interest
ADA Daily Chart
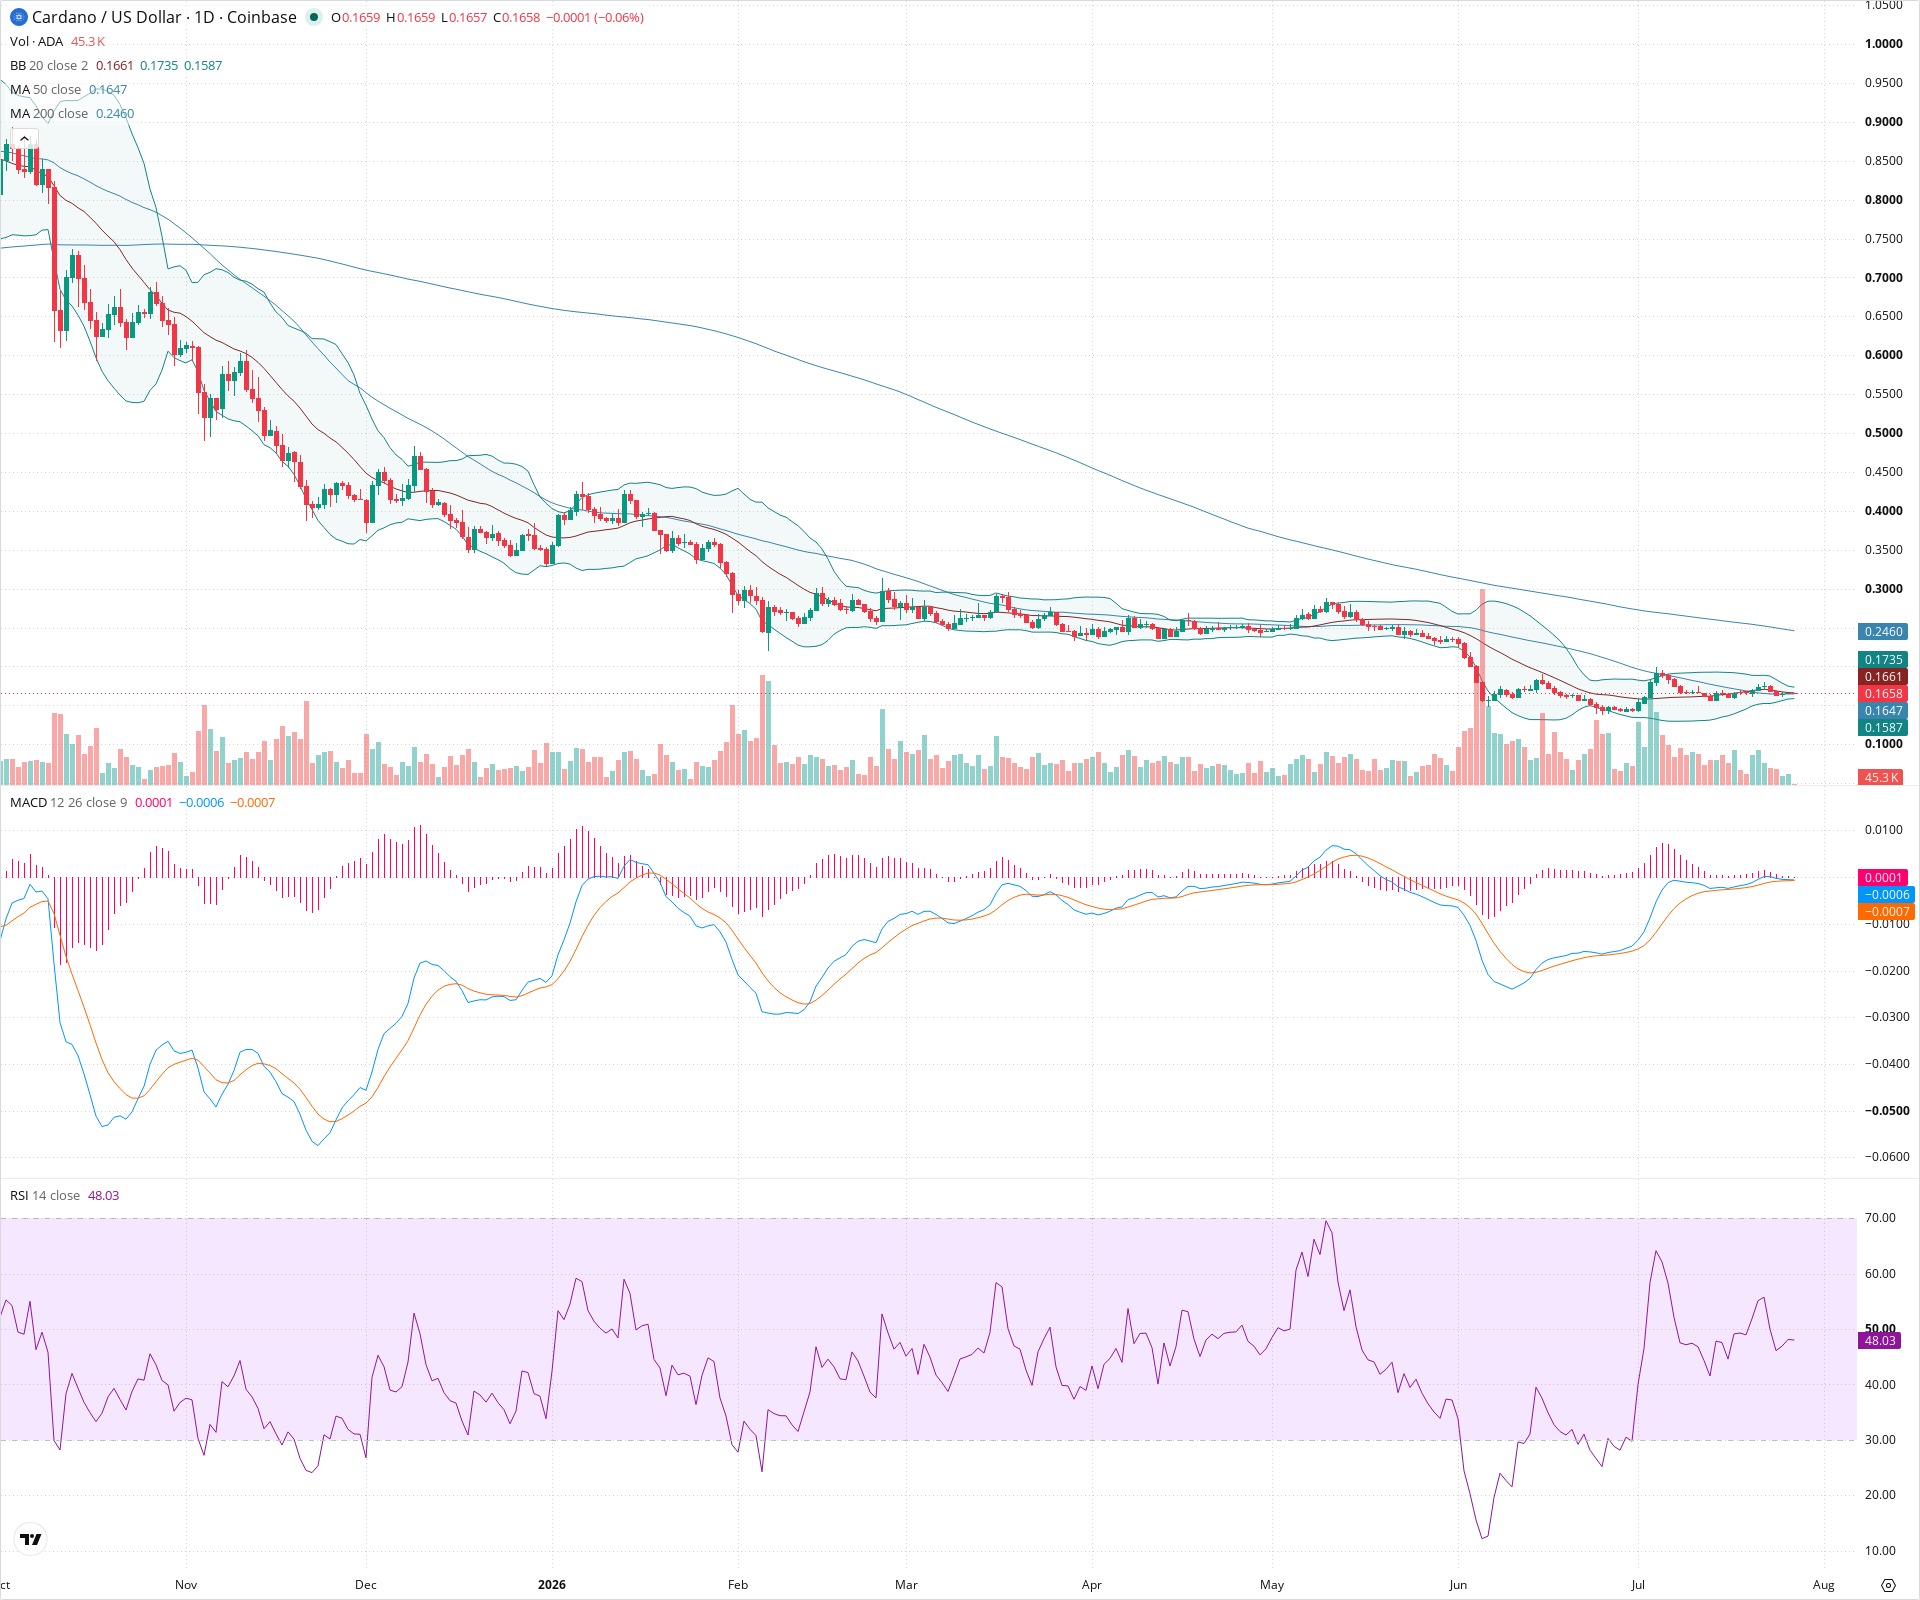
Sentiment
Short-term Sentiment (days to weeks): Neutral
Price is trading sideways in a tight range, caught between the 20-day and 50-day moving averages. The RSI is sitting near the midpoint at 48, and the MACD histogram is essentially flat, indicating a lack of clear momentum in either direction.
Long-term Sentiment (weeks to months): Bearish
The macro trend remains definitively negative. The price is significantly below a steeply declining 200-day SMA, and the chart consists of a long sequence of lower highs and lower lows over the visible period.
Report Metadata
- Timeframe: daily
- Generated at: 2026-07-27T00:03:15.098Z
- Model: gemini-3.1-pro-preview
Support Price Levels
| Level | Range | Strength | Notes |
|---|---|---|---|
| $0.16 | $0.16 - $0.16 | Weak | Immediate short-term support established by recent consolidation lows and aligning near the lower Bollinger Band. |
| $0.14 | $0.13 - $0.14 | Strong | Major capitulation low from the high-volume breakdown event in early June. |
Resistance Price Levels
| Level | Range | Strength | Notes |
|---|---|---|---|
| $0.17 | $0.17 - $0.18 | Weak | Upper boundary of the current consolidation channel and the upper Bollinger Band. |
| $0.21 | $0.20 - $0.21 | Strong | Previous major support zone that was aggressively broken in June, now expected to act as heavy resistance. |
| $0.25 | $0.24 - $0.25 | Strong | Dynamic resistance provided by the declining 200-day SMA and prior structural consolidation. |
Potential Chart Patterns in Formation
| Strength | Pattern | Signal | Target | Details |
|---|---|---|---|---|
| Strong | Bearish Consolidation Flag | Bearish | N/A | Following a massive downward impulse in early June, the price has entered a low-volatility, sideways consolidation phase. Given the preceding dominant downtrend, this pattern often resolves to the downside. |
Frequently Asked Questions about ADA
What is the current sentiment for ADA?
The short-term sentiment for ADA is currently Neutral because Price is trading sideways in a tight range, caught between the 20-day and 50-day moving averages. The RSI is sitting near the midpoint at 48, and the MACD histogram is essentially flat, indicating a lack of clear momentum in either direction.. The long-term trend is classified as Bearish.
What are the key support levels for ADA?
StockDips.AI has identified key support levels for ADA at $0.16 and $0.14. These levels may represent potential accumulation zones where buying interest could emerge.
Is ADA in a significant dip or a Value Dip right now?
ADA has a Value Score of 52/100. It is not currently flagged as a significant dip in the Top Dips list. It is not listed as a Value Dip because the long-term sentiment or value-score threshold does not qualify.
View the full interactive analysis on StockDips.AI.