ETH Daily Technical Analysis
Ethereum
Blockchain platform that enables smart contracts and decentralized applications (dApps).
ETH Technical Analysis Summary
ETH has mounted a strong short-term recovery, establishing a clear uptrend supported by short-term moving averages and positive momentum indicators like the MACD and RSI. However, for long-term investors, the technical picture remains mixed as the price is still capped by the descending 200-day SMA. A decisive breakout above this key long-term resistance level is required to signal a true macro trend reversal.
Included In Lists
Related Tickers of Interest
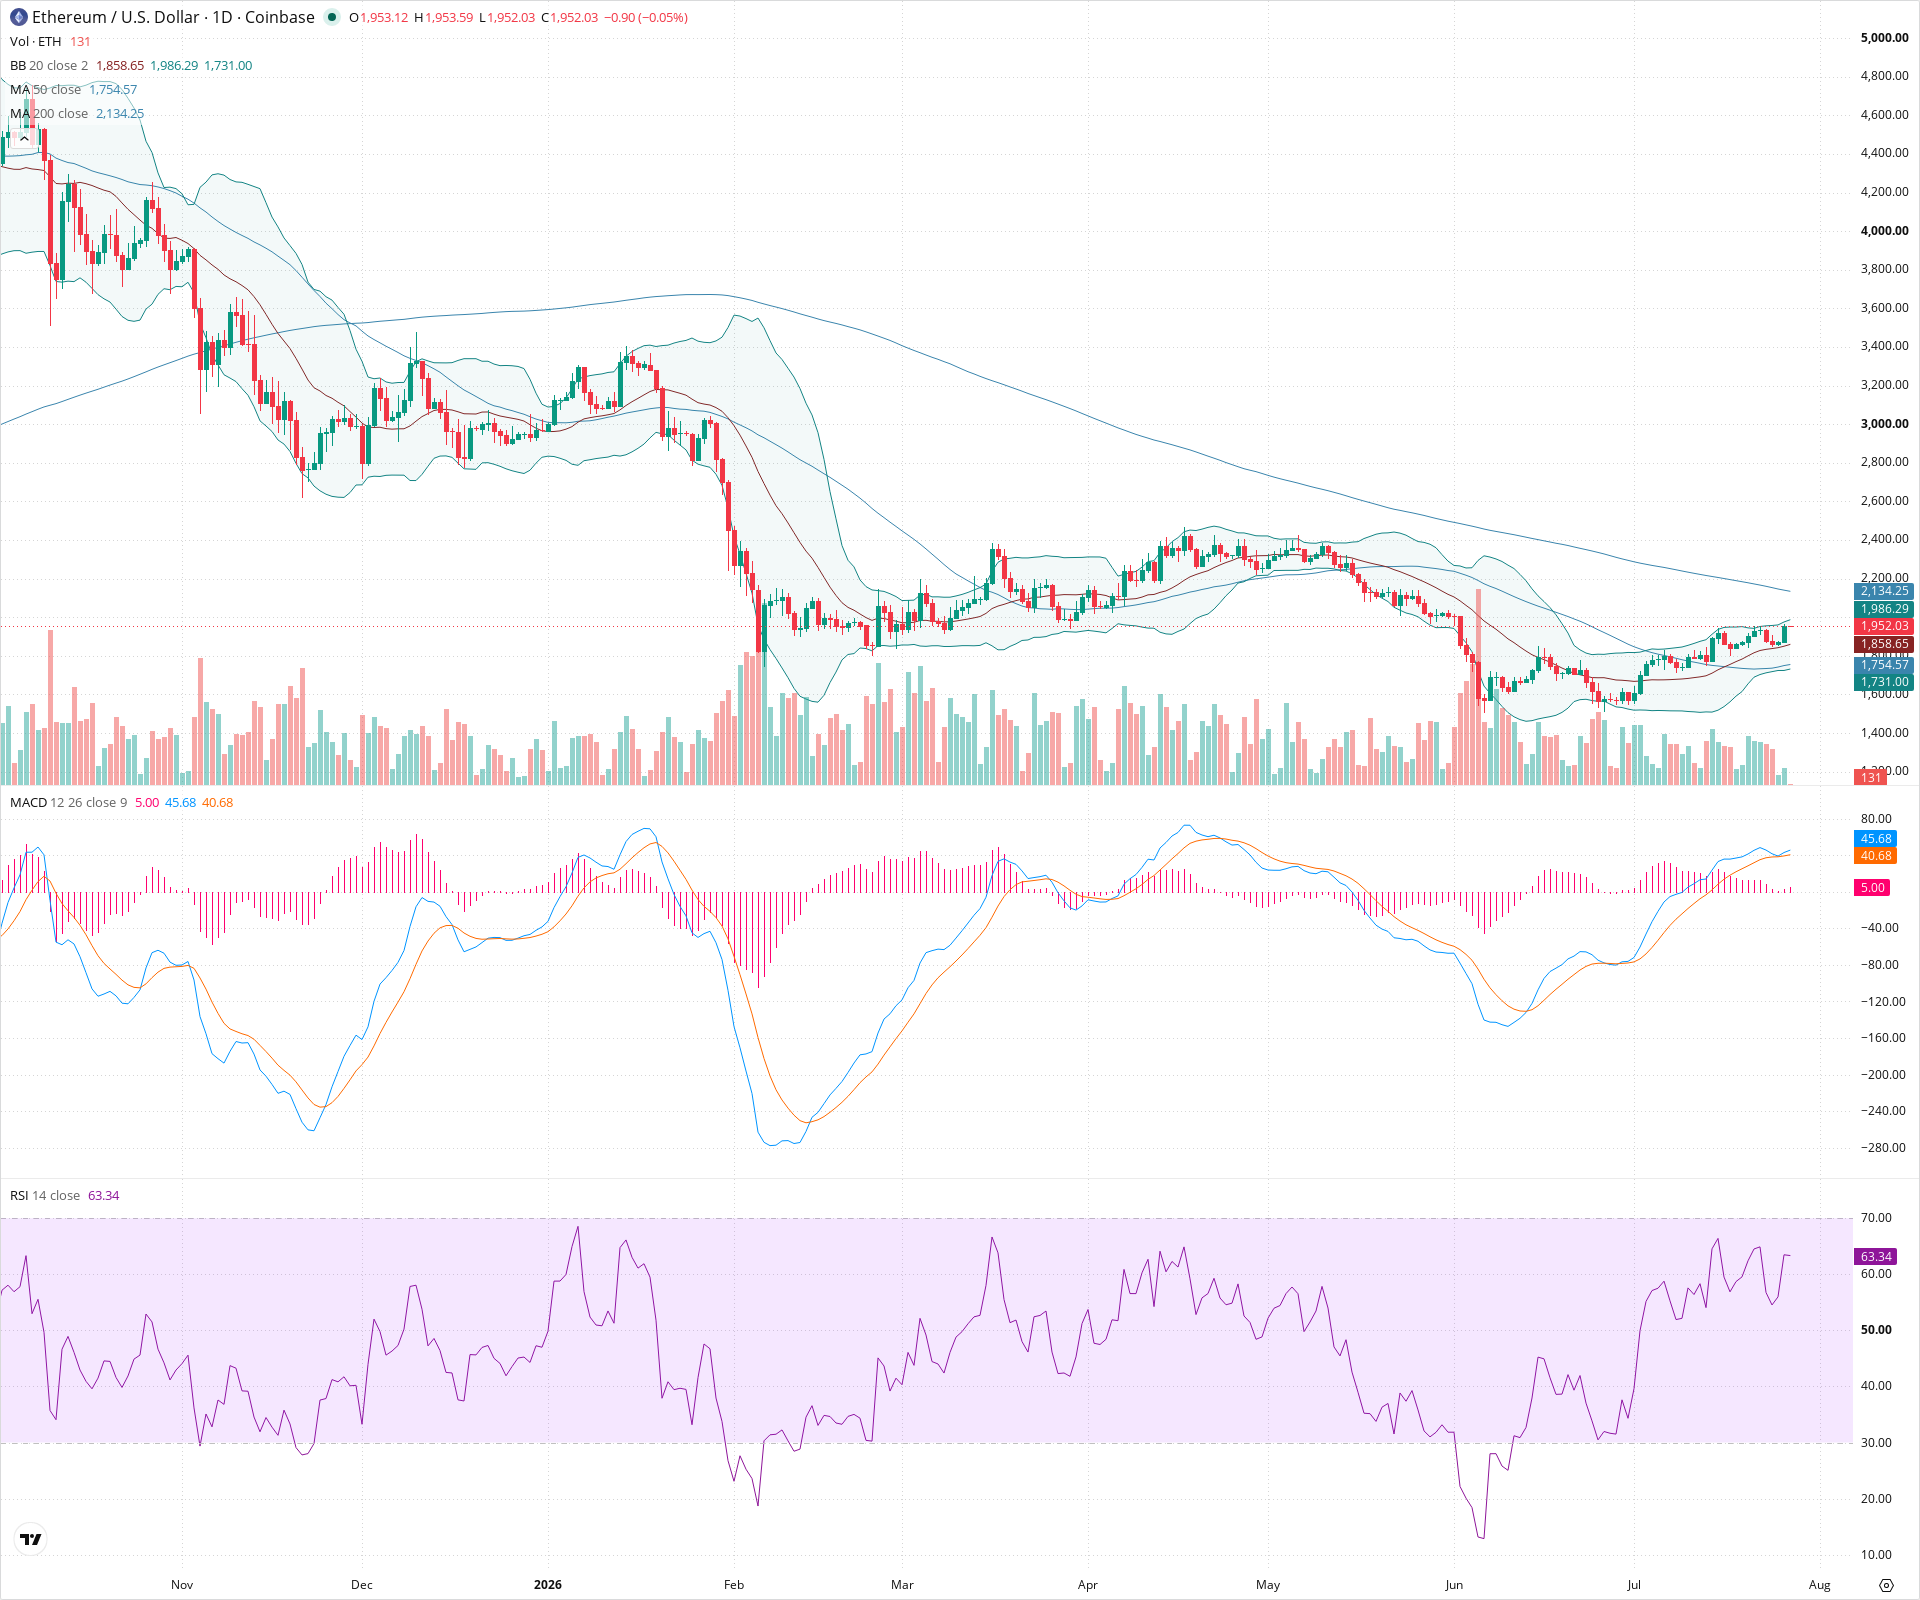
ETH Daily Chart
Sentiment
Short-term Sentiment (days to weeks): Bullish
Price is in a clear short-term uptrend making higher highs and higher lows. It is trading above both the rising 20-day and 50-day SMAs, hugging the upper Bollinger Band. Bullish momentum is confirmed by a positive MACD histogram and an RSI above 60.
Long-term Sentiment (weeks to months): Neutral
While the recent recovery is strong, the price remains below the declining 200-day SMA, indicating the macro downtrend has not yet fully reversed. The asset is in a transitional phase between a deep correction and a potential new bull market.
Report Metadata
- Timeframe: daily
- Generated at: 2026-07-27T00:01:10.698Z
- Model: gemini-3.1-pro-preview
Support Price Levels
| Level | Range | Strength | Notes |
|---|---|---|---|
| $1,860.00 | $1,840.00 - $1,880.00 | Moderate | Zone around the rising 20-day SMA (middle Bollinger Band), which has acted as dynamic support during the recent rally. |
| $1,750.00 | $1,730.00 - $1,770.00 | Strong | Confluence of the 50-day SMA, the lower Bollinger Band, and a recent area of price consolidation. |
Resistance Price Levels
| Level | Range | Strength | Notes |
|---|---|---|---|
| $2,000.00 | $1,980.00 - $2,020.00 | Moderate | Immediate resistance at the expanding upper Bollinger Band and recent local highs. |
| $2,125.00 | $2,100.00 - $2,150.00 | Strong | Major long-term resistance defined by the descending 200-day SMA and previous structural breakdown levels. |
Potential Chart Patterns in Formation
| Strength | Pattern | Signal | Target | Details |
|---|---|---|---|---|
| Strong | Ascending Channel | Bullish | N/A | Since the capitulation low in June, the price has been steadily climbing within an upward-sloping channel, defined by consistent higher highs and higher lows. |
| Strong | V-Shaped Recovery | Bullish | $2,134.00 | The chart shows a sharp, deep sell-off followed immediately by a sustained and aggressive rally without significant retests of the absolute bottom. |
Frequently Asked Questions about ETH
What is the current sentiment for ETH?
The short-term sentiment for ETH is currently Bullish because Price is in a clear short-term uptrend making higher highs and higher lows. It is trading above both the rising 20-day and 50-day SMAs, hugging the upper Bollinger Band. Bullish momentum is confirmed by a positive MACD histogram and an RSI above 60.. The long-term trend is classified as Neutral.
What are the key support levels for ETH?
StockDips.AI has identified key support levels for ETH at $1,860.00 and $1,750.00. These levels may represent potential accumulation zones where buying interest could emerge.
Is ETH in a significant dip or a Value Dip right now?
ETH has a Value Score of 43/100. It is not currently flagged as a significant dip in the Top Dips list. It is not listed as a Value Dip because the long-term sentiment or value-score threshold does not qualify.
View the full interactive analysis on StockDips.AI.