BTC Daily Technical Analysis
Bitcoin
The first and largest cryptocurrency, created as decentralized digital money with a capped supply of 21 million coins.
BTC Technical Analysis Summary
Bitcoin has established a solid short-term recovery off the critical 56,000 support zone, reclaiming the 50-day SMA and flashing bullish momentum signals on the MACD. For long-term investors, the macro picture remains mixed until the price can successfully challenge and break above the 200-day SMA near 72,000 to reverse the broader sequence of lower highs.
Included In Lists
Related Tickers of Interest
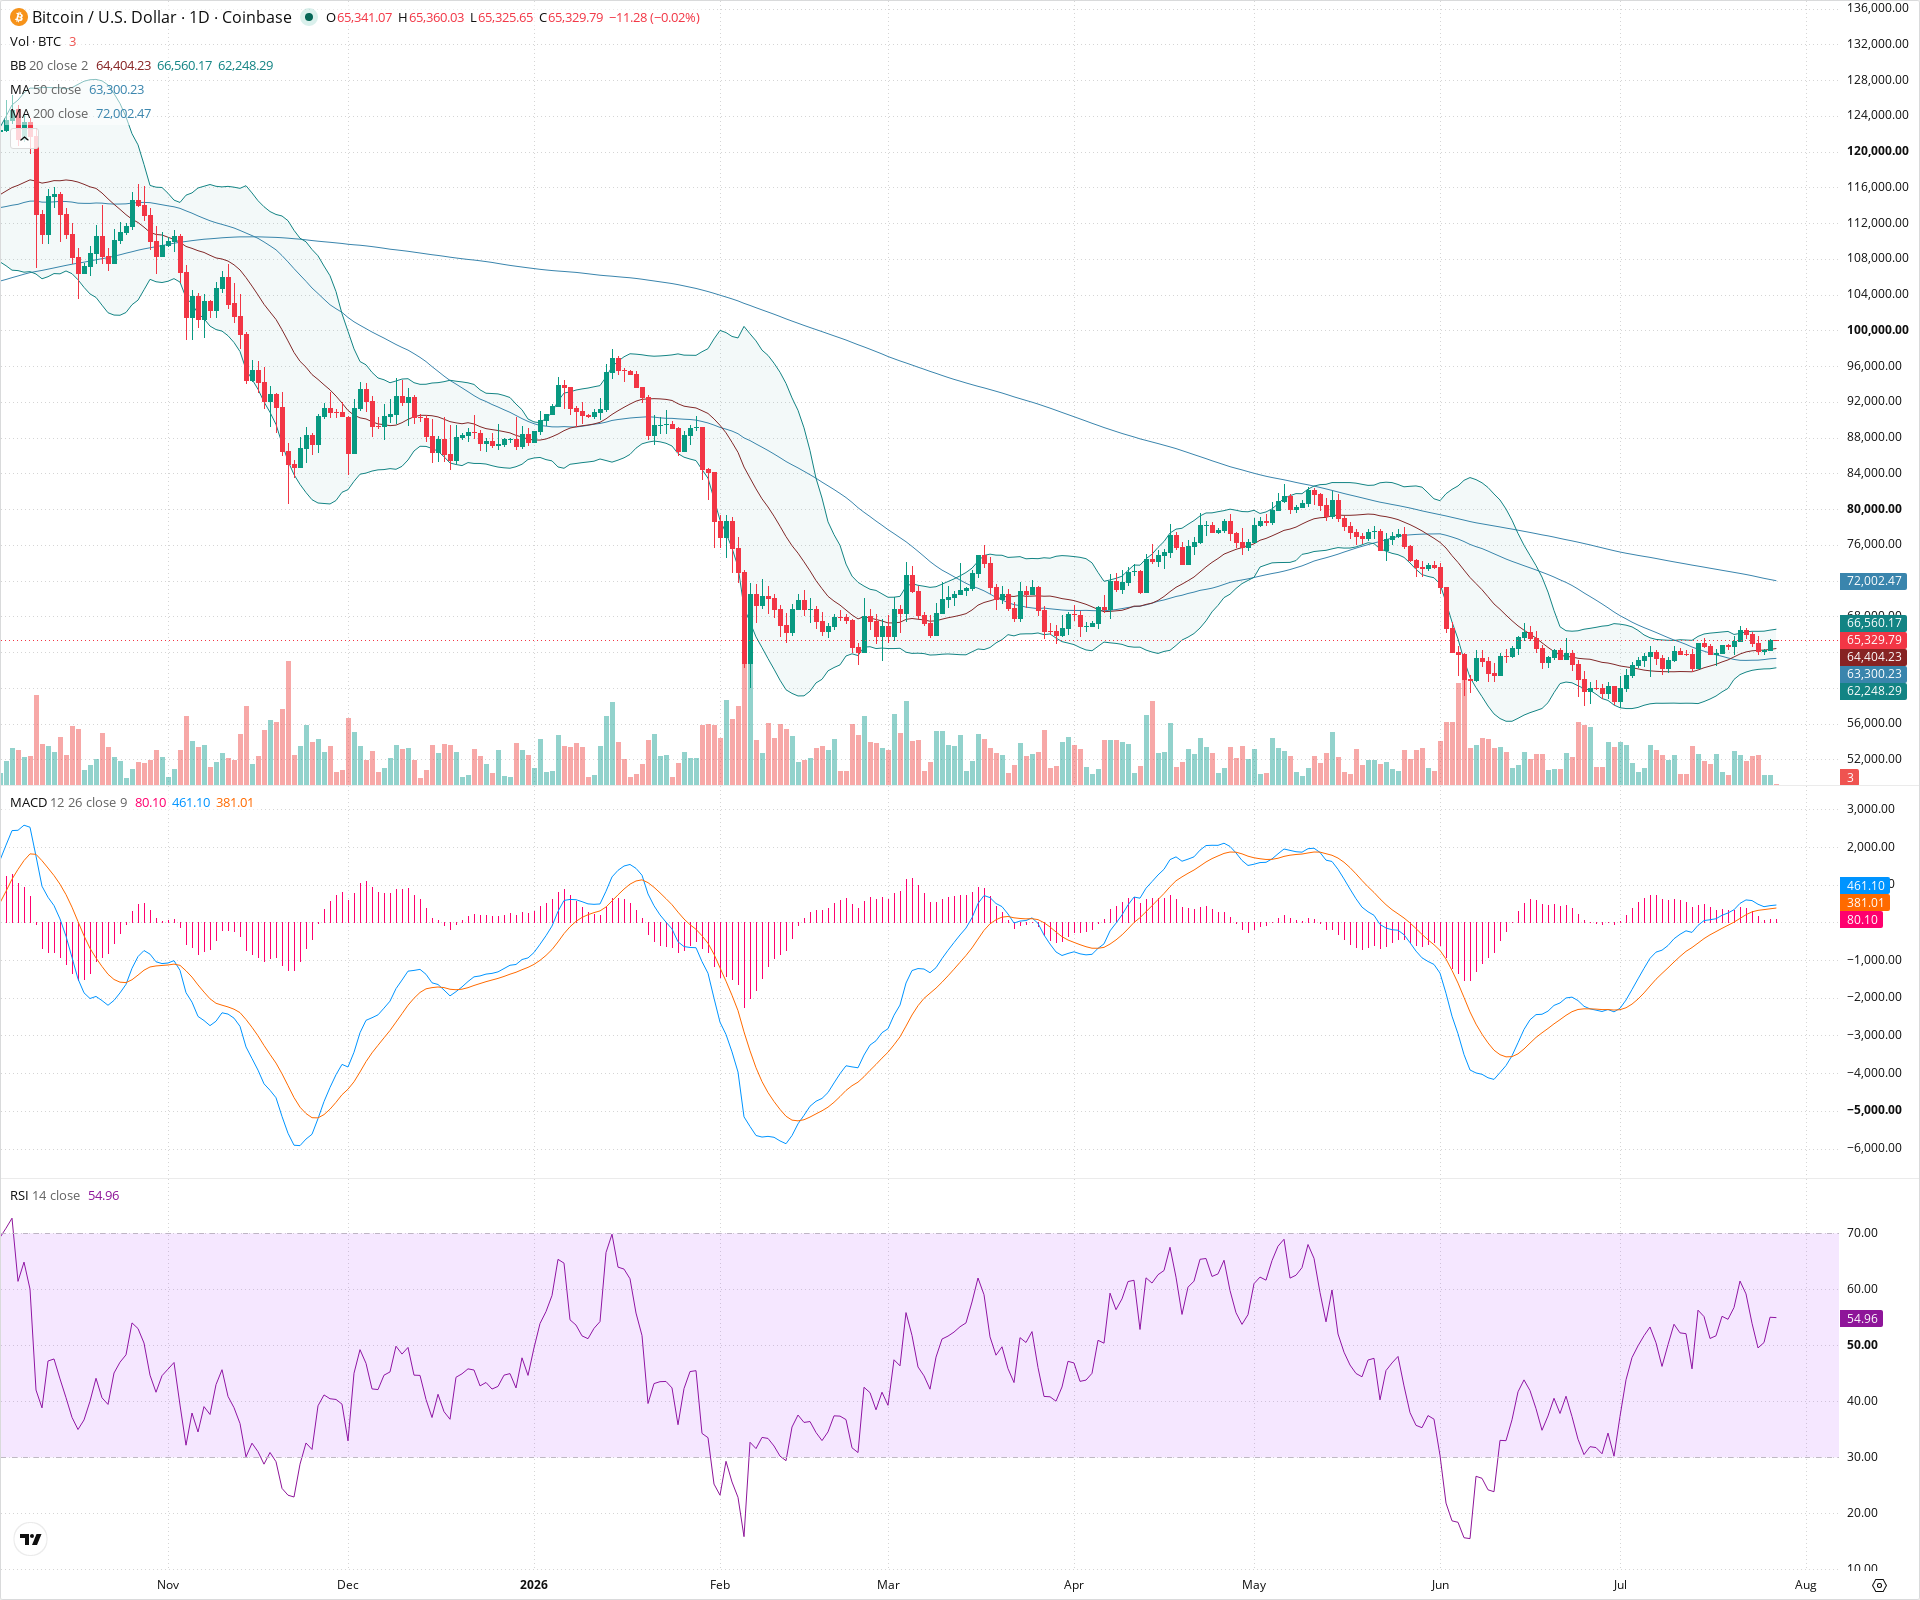
BTC Daily Chart
Sentiment
Short-term Sentiment (days to weeks): Bullish
Price has rebounded from recent lows, crossing above both the 20-day and 50-day SMAs. The RSI is trending upwards above 50, and the MACD line has crossed above the signal line with a positive histogram, confirming short-term upside momentum.
Long-term Sentiment (weeks to months): Neutral
While short-term momentum is improving, the price remains below the descending 200-day SMA. A break above this key moving average and previous lower highs is needed to shift the macro trend to bullish.
Report Metadata
- Timeframe: daily
- Generated at: 2026-07-27T00:00:58.298Z
- Model: gemini-3.1-pro-preview
Support Price Levels
| Level | Range | Strength | Notes |
|---|---|---|---|
| $63,200.00 | $62,000.00 - $64,400.00 | Strong | Convergence zone of the 50-day SMA and the 20-day SMA (middle Bollinger Band), along with recent consolidation. |
| $57,000.00 | $56,000.00 - $58,000.00 | Strong | Major swing lows from early May and early July, forming a significant macro support floor. |
Resistance Price Levels
| Level | Range | Strength | Notes |
|---|---|---|---|
| $70,000.00 | $68,000.00 - $72,000.00 | Strong | Zone encompassing recent swing highs from June and the declining 200-day SMA. |
| $78,000.00 | $76,000.00 - $80,000.00 | Strong | Major prior support area from earlier in the year that has now flipped to overhead resistance. |
Potential Chart Patterns in Formation
| Strength | Pattern | Signal | Target | Details |
|---|---|---|---|---|
| Weak | Double Bottom | Bullish | $72,000.00 | Price found support near 56k twice (early May and early July), creating a potential double bottom base. |
| Strong | Short-term Uptrend Channel | Bullish | N/A | Since the July low, price has been making higher highs and higher lows, guided upwards by the 20-day moving average. |
Frequently Asked Questions about BTC
What is the current sentiment for BTC?
The short-term sentiment for BTC is currently Bullish because Price has rebounded from recent lows, crossing above both the 20-day and 50-day SMAs. The RSI is trending upwards above 50, and the MACD line has crossed above the signal line with a positive histogram, confirming short-term upside momentum.. The long-term trend is classified as Neutral.
What are the key support levels for BTC?
StockDips.AI has identified key support levels for BTC at $63,200.00 and $57,000.00. These levels may represent potential accumulation zones where buying interest could emerge.
Is BTC in a significant dip or a Value Dip right now?
BTC has a Value Score of 74/100. It is currently flagged as a significant dip in the Top Dips list. It is not listed as a Value Dip because the long-term sentiment or value-score threshold does not qualify.
View the full interactive analysis on StockDips.AI.