ADA Weekly Technical Analysis
Cardano
ADA is the native cryptocurrency of Cardano, a Proof-of-Stake (PoS) blockchain platform built for scalability, security, and sustainability, aiming to be a "next-gen" evolution of Ethereum for smart contracts and decentralized apps (dApps)
ADA Technical Analysis Summary
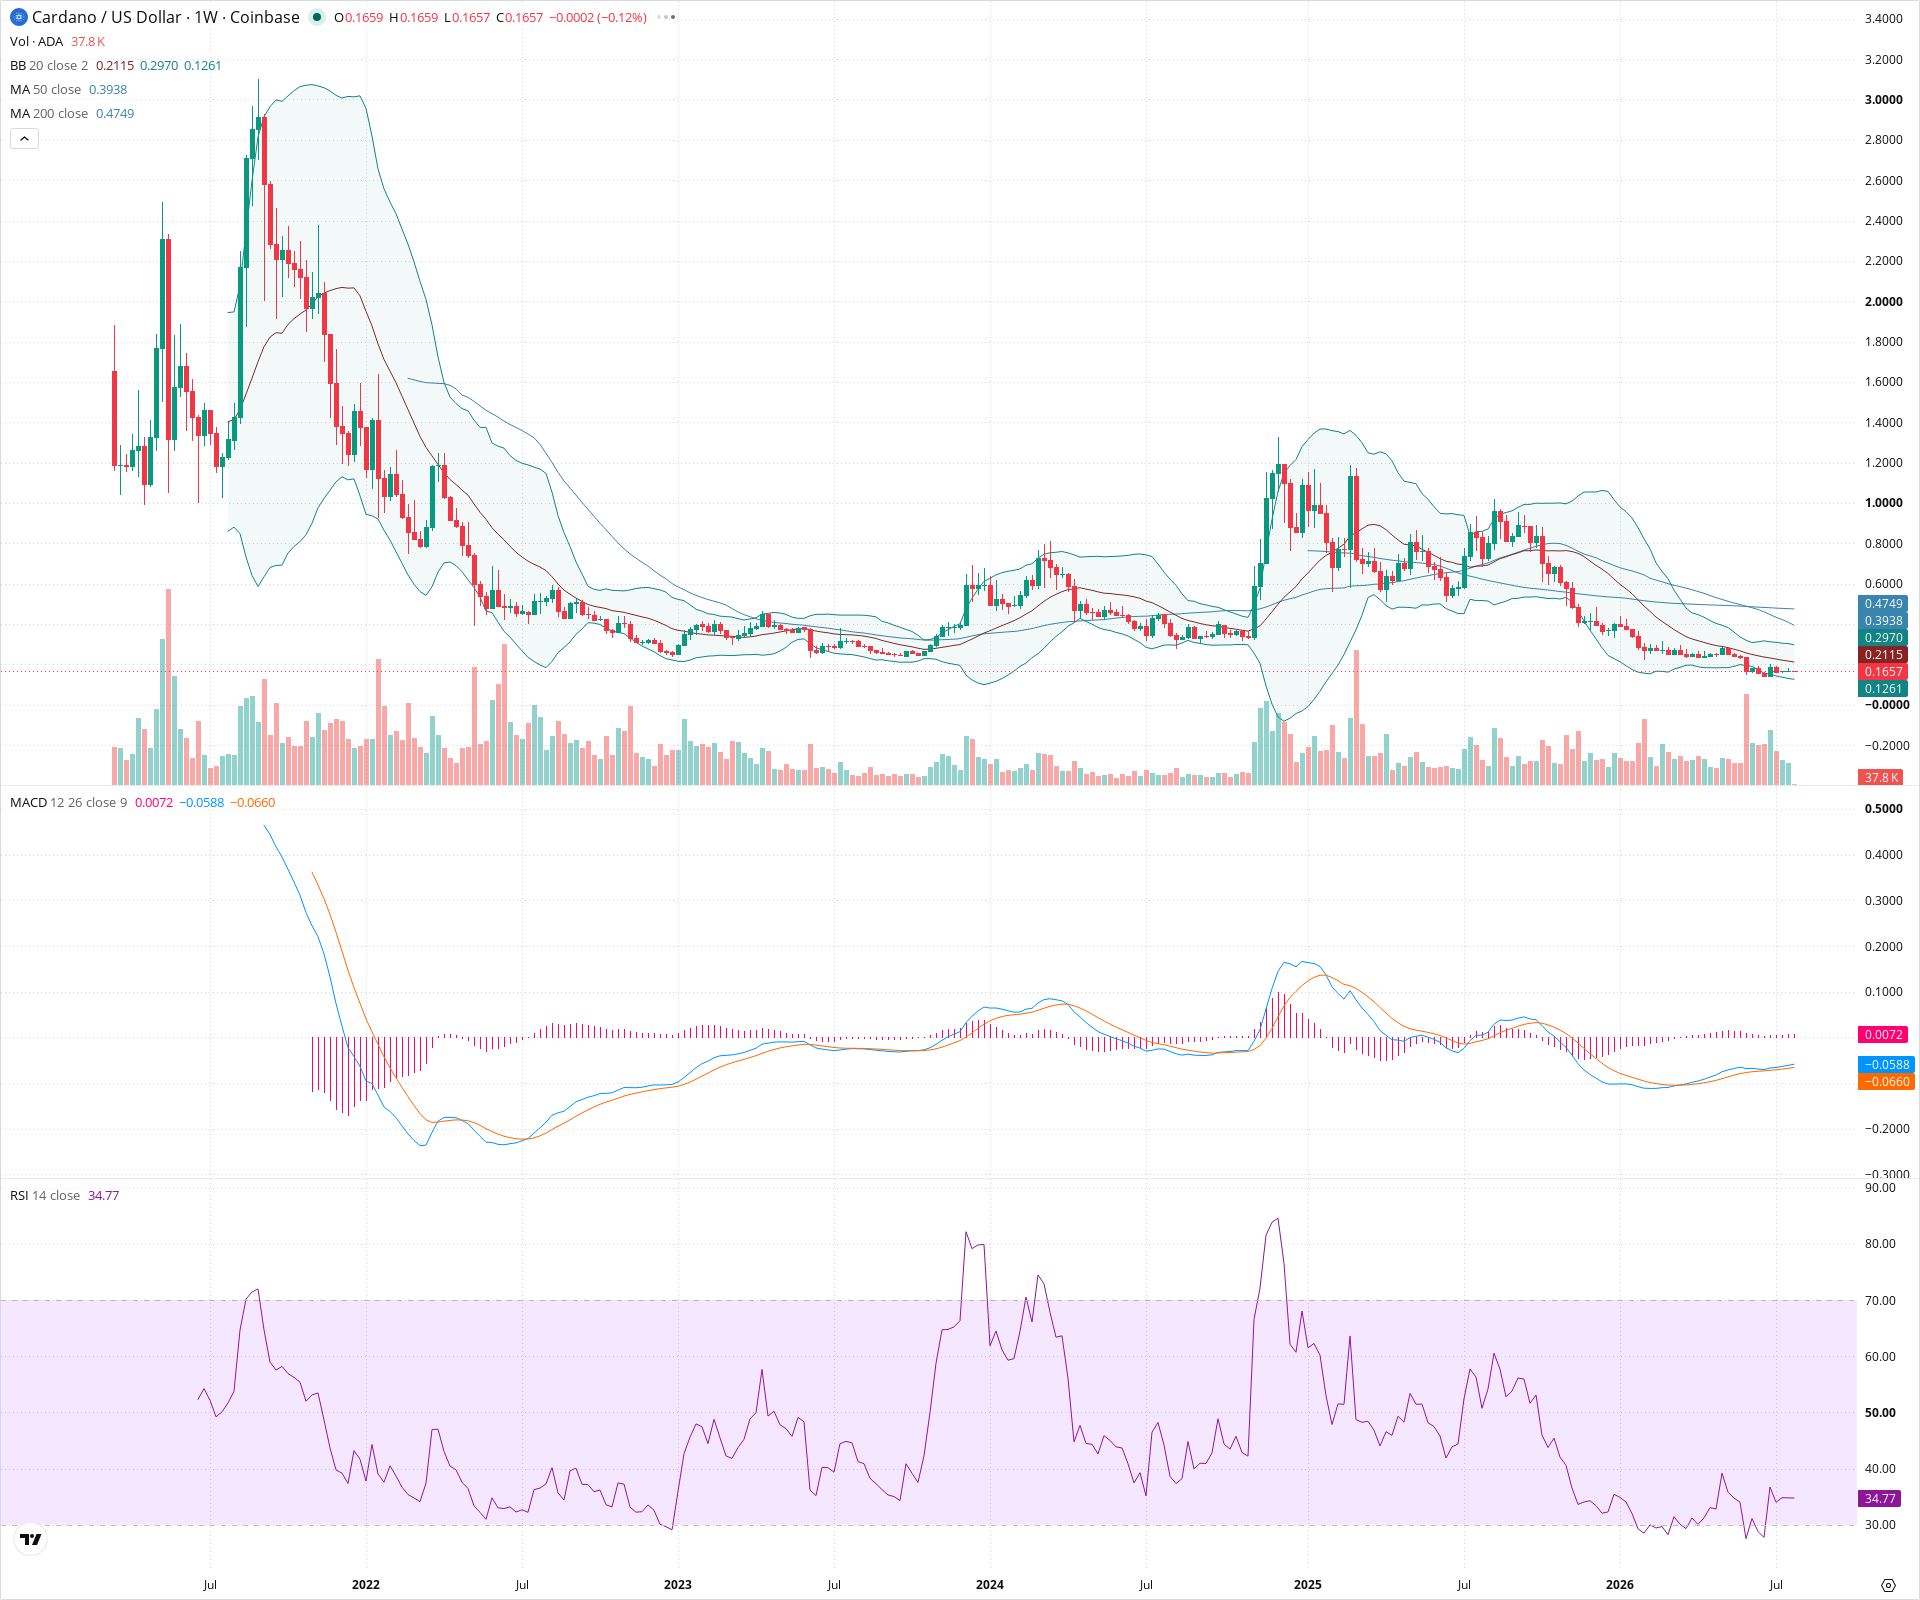
ADA is currently in an extended period of sideways consolidation on the weekly chart following a prolonged downtrend. The price remains constrained below major moving averages, with both RSI and MACD reflecting a lack of significant momentum. A decisive break above the 0.3000 resistance level would be needed to suggest a shift in the longer-term bearish structure.
Included In Lists
Related Tickers of Interest
ADA Weekly Chart
Sentiment
Short-term Sentiment (days to weeks): Neutral
Price is consolidating near recent lows, slightly below the 50-week SMA and 200-week SMA. RSI is in the neutral zone, and MACD lines are flat and near the zero line, indicating a lack of strong directional momentum.
Long-term Sentiment (weeks to months): Bearish
The long-term trend has been a persistent downtrend followed by an extended period of sideways consolidation below both the 50-week and 200-week SMAs, which are both sloping downward or flat.
Report Metadata
- Timeframe: weekly
- Generated at: 2026-07-27T00:02:36.204Z
- Model: gemini-3.1-pro-preview
Support Price Levels
| Level | Range | Strength | Notes |
|---|---|---|---|
| $0.16 | $0.15 - $0.16 | Strong | Recent consolidation lows acting as immediate support. |
| $0.13 | $0.12 - $0.13 | Weak | Previous minor swing low in the wider consolidation base. |
Resistance Price Levels
| Level | Range | Strength | Notes |
|---|---|---|---|
| $0.30 | $0.28 - $0.31 | Strong | Confluence area of recent swing highs and the 50-week SMA. |
| $0.48 | $0.45 - $0.50 | Strong | Significant previous resistance zone and proximity to the 200-week SMA. |
Potential Chart Patterns in Formation
| Strength | Pattern | Signal | Target | Details |
|---|---|---|---|---|
| Strong | Sideways Consolidation | Neutral | N/A | Price has been trading in a multi-year horizontal range after a significant downtrend. |
Frequently Asked Questions about ADA
What is the current sentiment for ADA?
The short-term sentiment for ADA is currently Neutral because Price is consolidating near recent lows, slightly below the 50-week SMA and 200-week SMA. RSI is in the neutral zone, and MACD lines are flat and near the zero line, indicating a lack of strong directional momentum.. The long-term trend is classified as Bearish.
What are the key support levels for ADA?
StockDips.AI has identified key support levels for ADA at $0.16 and $0.13. These levels may represent potential accumulation zones where buying interest could emerge.
Is ADA in a significant dip or a Value Dip right now?
ADA has a Value Score of 50/100. It is not currently flagged as a significant dip in the Top Dips list. It is not listed as a Value Dip because the long-term sentiment or value-score threshold does not qualify.
View the full interactive analysis on StockDips.AI.