DOGE Daily Technical Analysis
Dogecoin
A meme-inspired cryptocurrency with a strong community and fast transaction times.
DOGE Technical Analysis Summary
DOGE is firmly entrenched in a long-term macroeconomic downtrend, trading well below key moving averages. Recently, the asset has entered a period of low-volatility sideways consolidation following a significant drop, allowing oscillators like RSI and MACD to reset from oversold extremes. However, until immediate resistance at the 50-day SMA is decisively broken, the overarching market structure remains heavily bearish, favoring a 'sell the rally' environment.
Included In Lists
Related Tickers of Interest
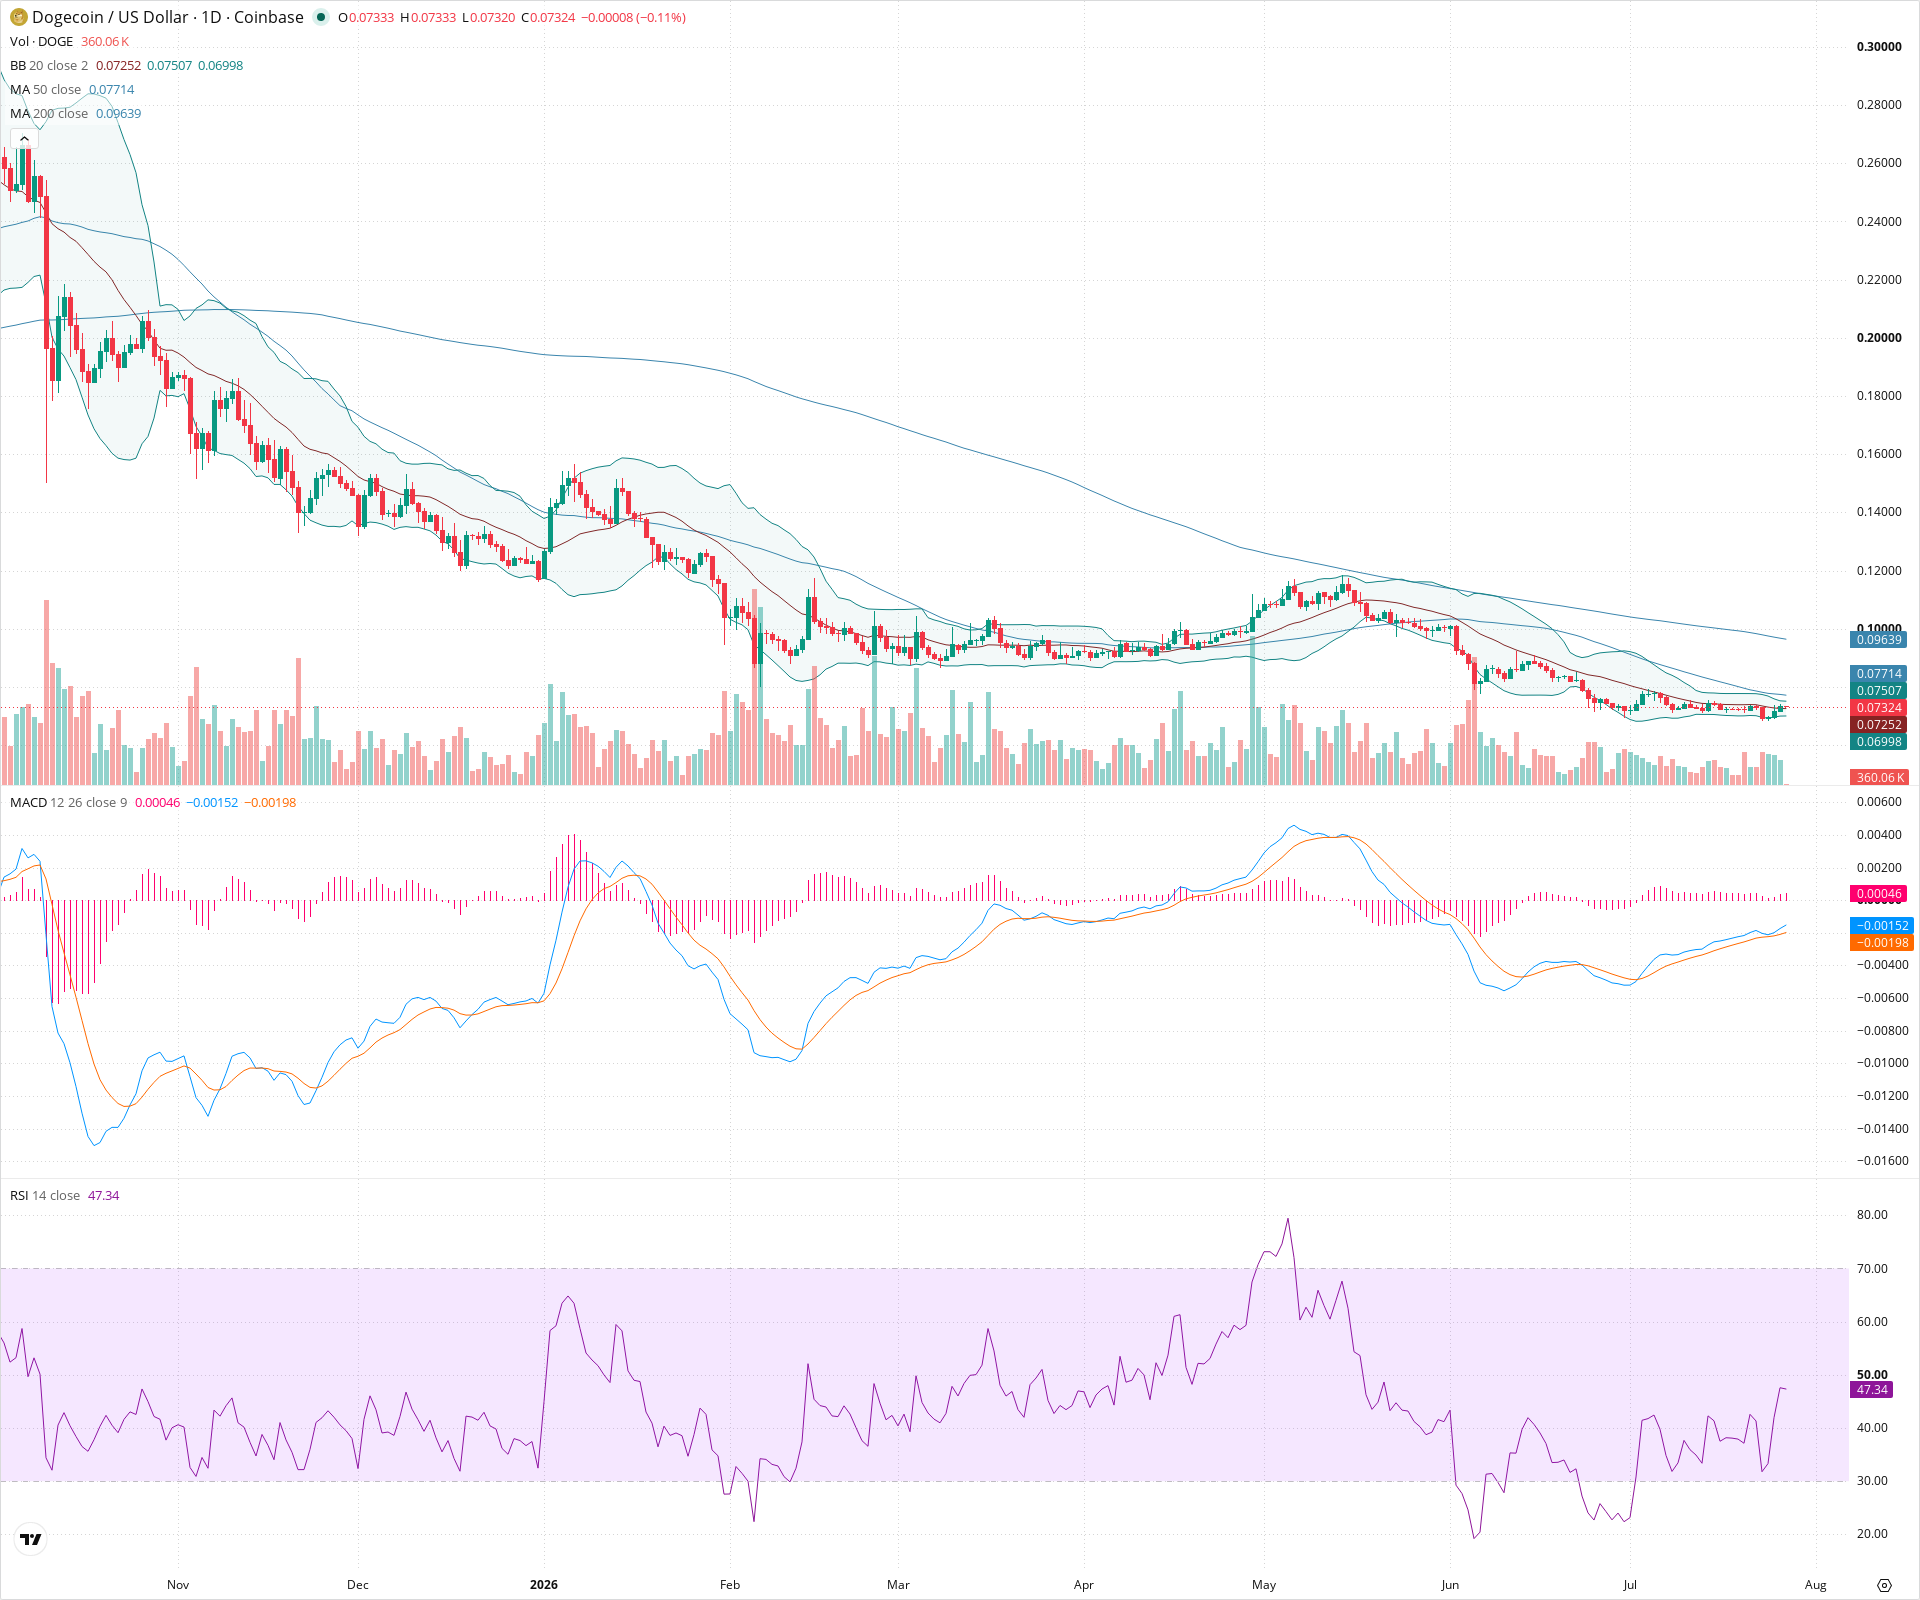
DOGE Daily Chart
Sentiment
Short-term Sentiment (days to weeks): Neutral
Price is trading in a tight consolidation range near the 20-day SMA. Momentum indicators are mixed; RSI is near the neutral 50 level, and while MACD has a bullish crossover with a positive histogram, it remains in negative territory below the zero line.
Long-term Sentiment (weeks to months): Bearish
The chart displays a clear, sustained downtrend characterized by a series of lower highs and lower lows. Price remains significantly below the declining 50-day and 200-day Simple Moving Averages.
Report Metadata
- Timeframe: daily
- Generated at: 2026-07-27T00:01:41.798Z
- Model: gemini-3.1-pro-preview
Support Price Levels
| Level | Range | Strength | Notes |
|---|---|---|---|
| $0.07 | $0.07 - $0.07 | Weak | Immediate near-term consolidation floor established over recent weeks. |
| $0.06 | $0.05 - $0.06 | Strong | Major swing low area created during the sharp capitulation event in early to mid-June. |
Resistance Price Levels
| Level | Range | Strength | Notes |
|---|---|---|---|
| $0.08 | $0.08 - $0.08 | Strong | Confluence of recent swing highs, the upper Bollinger Band, and the descending 50-day SMA. |
| $0.10 | $0.10 - $0.11 | Strong | Major structural resistance zone combining historical support-turned-resistance, psychological $0.10 level, and the 200-day SMA. |
Potential Chart Patterns in Formation
| Strength | Pattern | Signal | Target | Details |
|---|---|---|---|---|
| Weak | Potential Bear Flag | Bearish | N/A | Following a steep downward move in June, price action has been consolidating sideways to slightly upwards in a relatively narrow range, which may act as a continuation pattern for the broader downtrend if support fails. |
Frequently Asked Questions about DOGE
What is the current sentiment for DOGE?
The short-term sentiment for DOGE is currently Neutral because Price is trading in a tight consolidation range near the 20-day SMA. Momentum indicators are mixed; RSI is near the neutral 50 level, and while MACD has a bullish crossover with a positive histogram, it remains in negative territory below the zero line.. The long-term trend is classified as Bearish.
What are the key support levels for DOGE?
StockDips.AI has identified key support levels for DOGE at $0.07 and $0.06. These levels may represent potential accumulation zones where buying interest could emerge.
Is DOGE in a significant dip or a Value Dip right now?
DOGE has a Value Score of 58/100. It is not currently flagged as a significant dip in the Top Dips list. It is not listed as a Value Dip because the long-term sentiment or value-score threshold does not qualify.
View the full interactive analysis on StockDips.AI.