XRP Daily Technical Analysis
XRP
Designed for fast and low-cost cross-border payments and remittances.
XRP Technical Analysis Summary
XRP is currently exhibiting a firmly bearish long-term trend, remaining trapped below a declining 200-day SMA. However, short-term price action has stabilized into a tight consolidation pattern with contracting volatility, as evidenced by a Bollinger Band squeeze and neutral oscillator readings. Investors should watch for a high-volume breakout from the current range to signal the next major directional trend.
Included In Lists
Related Tickers of Interest
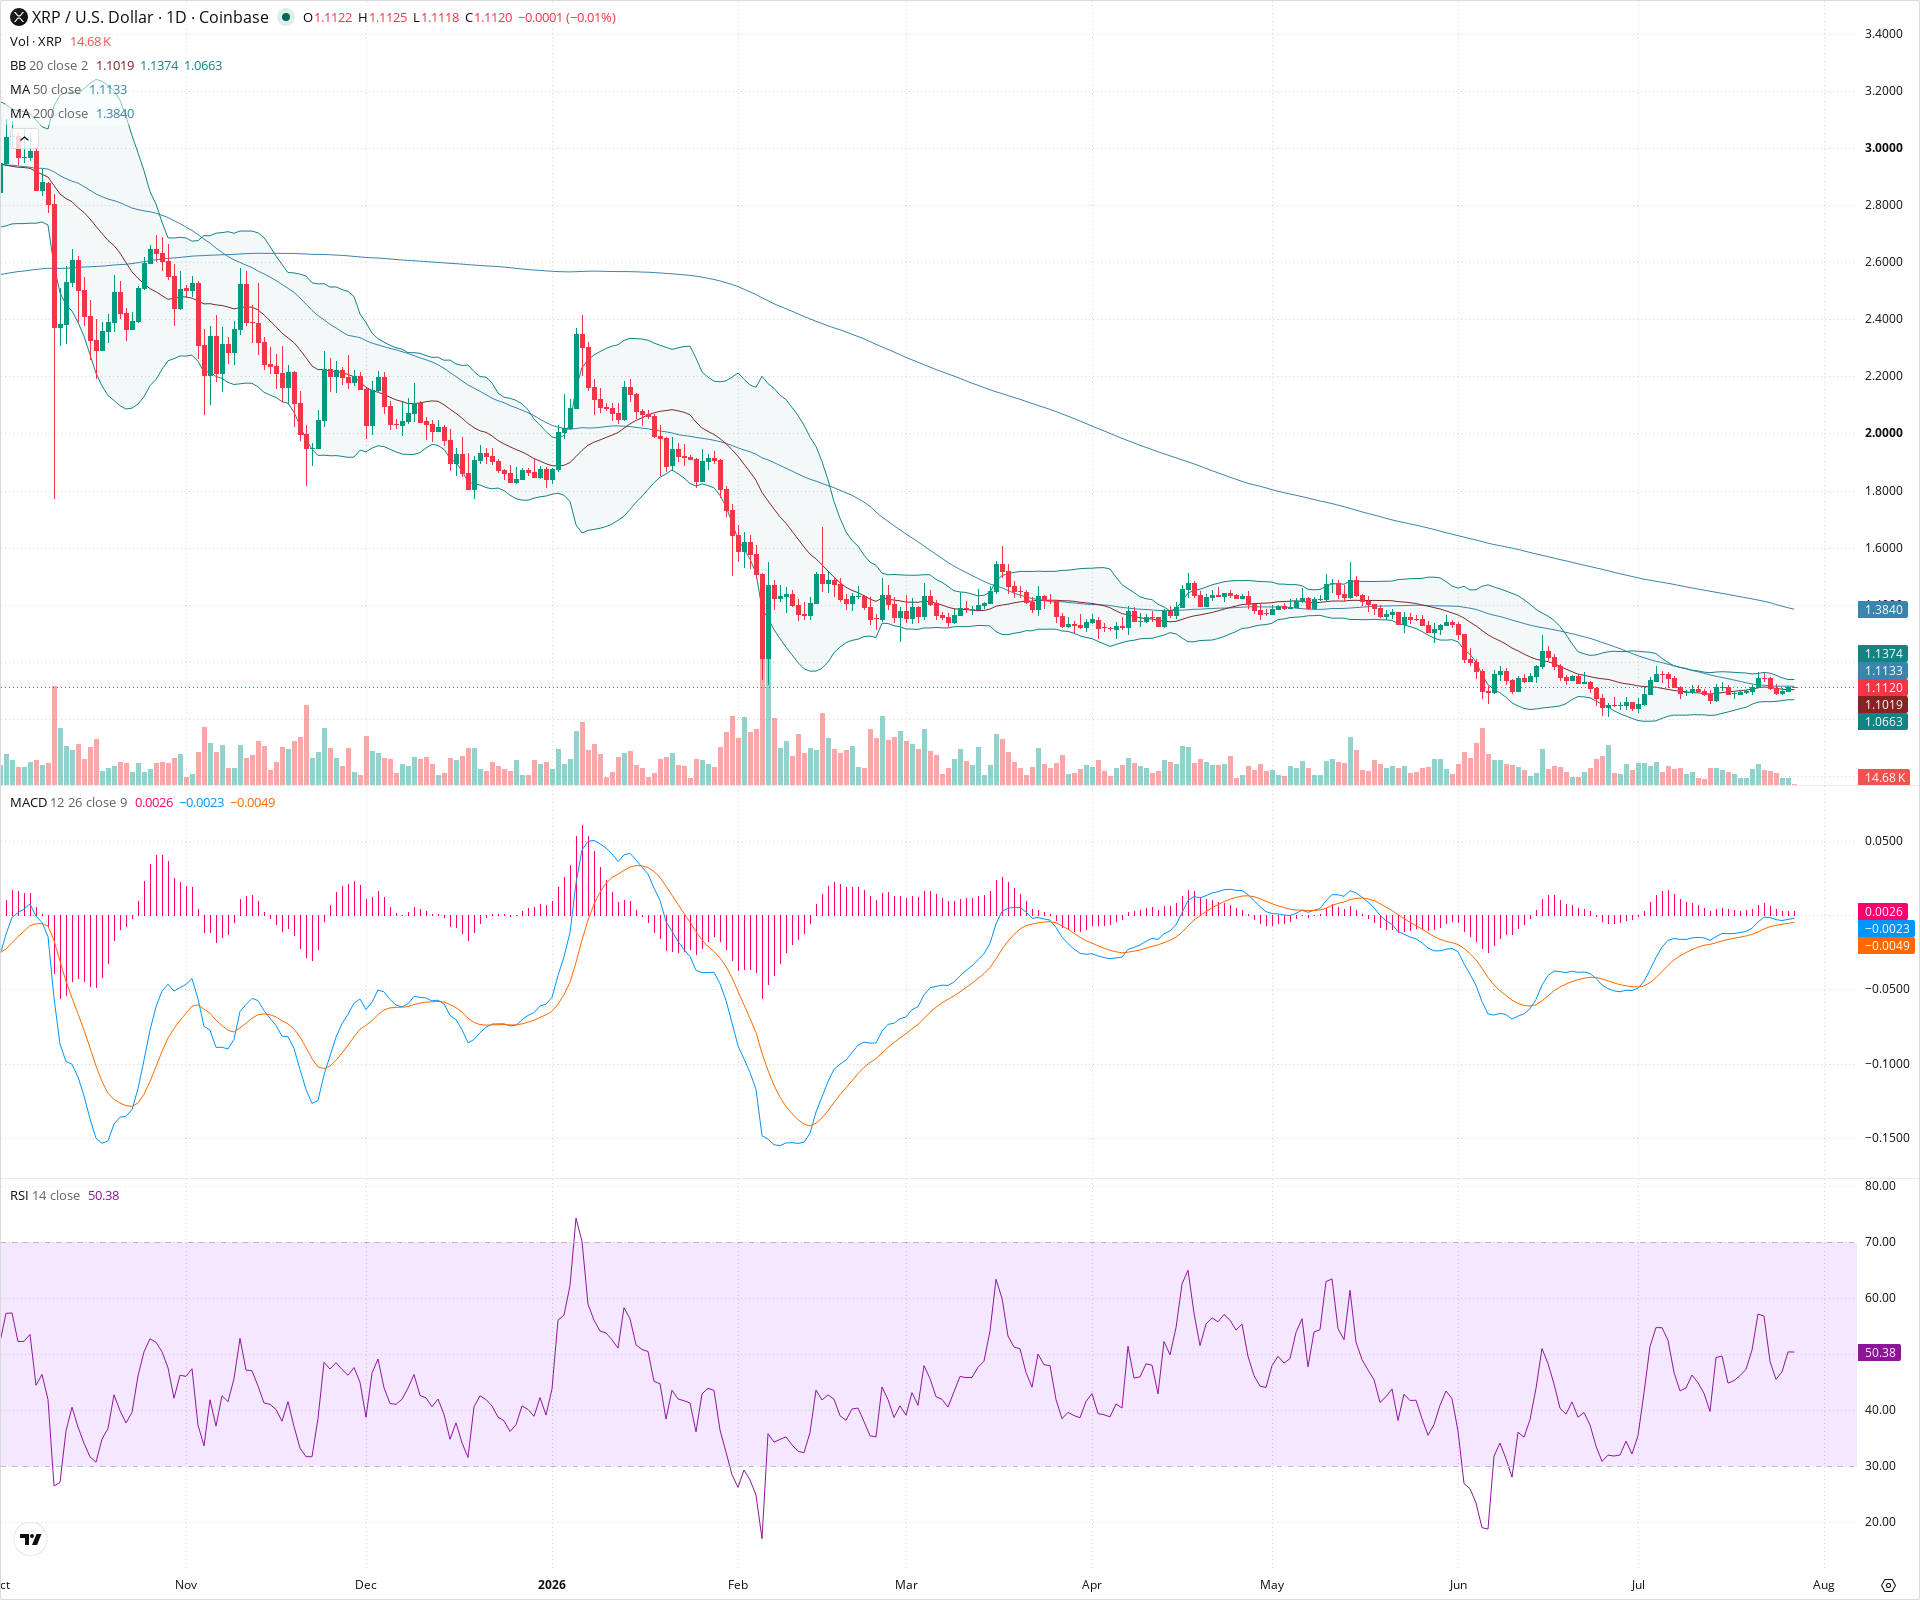
XRP Daily Chart
Sentiment
Short-term Sentiment (days to weeks): Neutral
Price is consolidating tightly around the 20-day and 50-day SMAs, with a visible Bollinger Band squeeze. RSI is flat near the 50 level, and MACD shows very weak momentum, indicating indecision in the near term.
Long-term Sentiment (weeks to months): Bearish
The major market structure consists of lower highs and lower lows, with price trading significantly below a downward-sloping 200-day SMA.
Report Metadata
- Timeframe: daily
- Generated at: 2026-07-27T00:01:03.999Z
- Model: gemini-3.1-pro-preview
Support Price Levels
| Level | Range | Strength | Notes |
|---|---|---|---|
| $1.03 | $1.00 - $1.05 | Strong | Recent swing lows established in June and July that have successfully halted further downside. |
Resistance Price Levels
| Level | Range | Strength | Notes |
|---|---|---|---|
| $1.35 | $1.30 - $1.40 | Strong | A structural resistance zone formed by previous consolidation highs, reinforced by the approaching 200-day SMA at approximately 1.3840. |
| $1.65 | $1.60 - $1.70 | Weak | Prior lower highs formed earlier in the year before a major leg down. |
Potential Chart Patterns in Formation
| Strength | Pattern | Signal | Target | Details |
|---|---|---|---|---|
| Strong | Bollinger Band Squeeze | Neutral | N/A | The Bollinger Bands have contracted significantly, indicating historically low volatility and suggesting a potential explosive breakout in either direction. |
| Strong | Horizontal Consolidation | Neutral | N/A | Price is trading sideways within a defined range after a prolonged markdown phase, attempting to build a base. |
Frequently Asked Questions about XRP
What is the current sentiment for XRP?
The short-term sentiment for XRP is currently Neutral because Price is consolidating tightly around the 20-day and 50-day SMAs, with a visible Bollinger Band squeeze. RSI is flat near the 50 level, and MACD shows very weak momentum, indicating indecision in the near term.. The long-term trend is classified as Bearish.
What are the key support levels for XRP?
StockDips.AI has identified key support levels for XRP at $1.03. These levels may represent potential accumulation zones where buying interest could emerge.
Is XRP in a significant dip or a Value Dip right now?
XRP has a Value Score of 76/100. It is currently flagged as a significant dip in the Top Dips list. It is not listed as a Value Dip because the long-term sentiment or value-score threshold does not qualify.
View the full interactive analysis on StockDips.AI.