ZEC Daily Technical Analysis
ZCash
Zcash (ZEC) is a privacy-focused cryptocurrency that enables optional anonymity for transactions by using advanced cryptography. While the Zcash protocol governs the network, ZEC is the native monetary unit, or coin, used for transactions.
ZEC Technical Analysis Summary
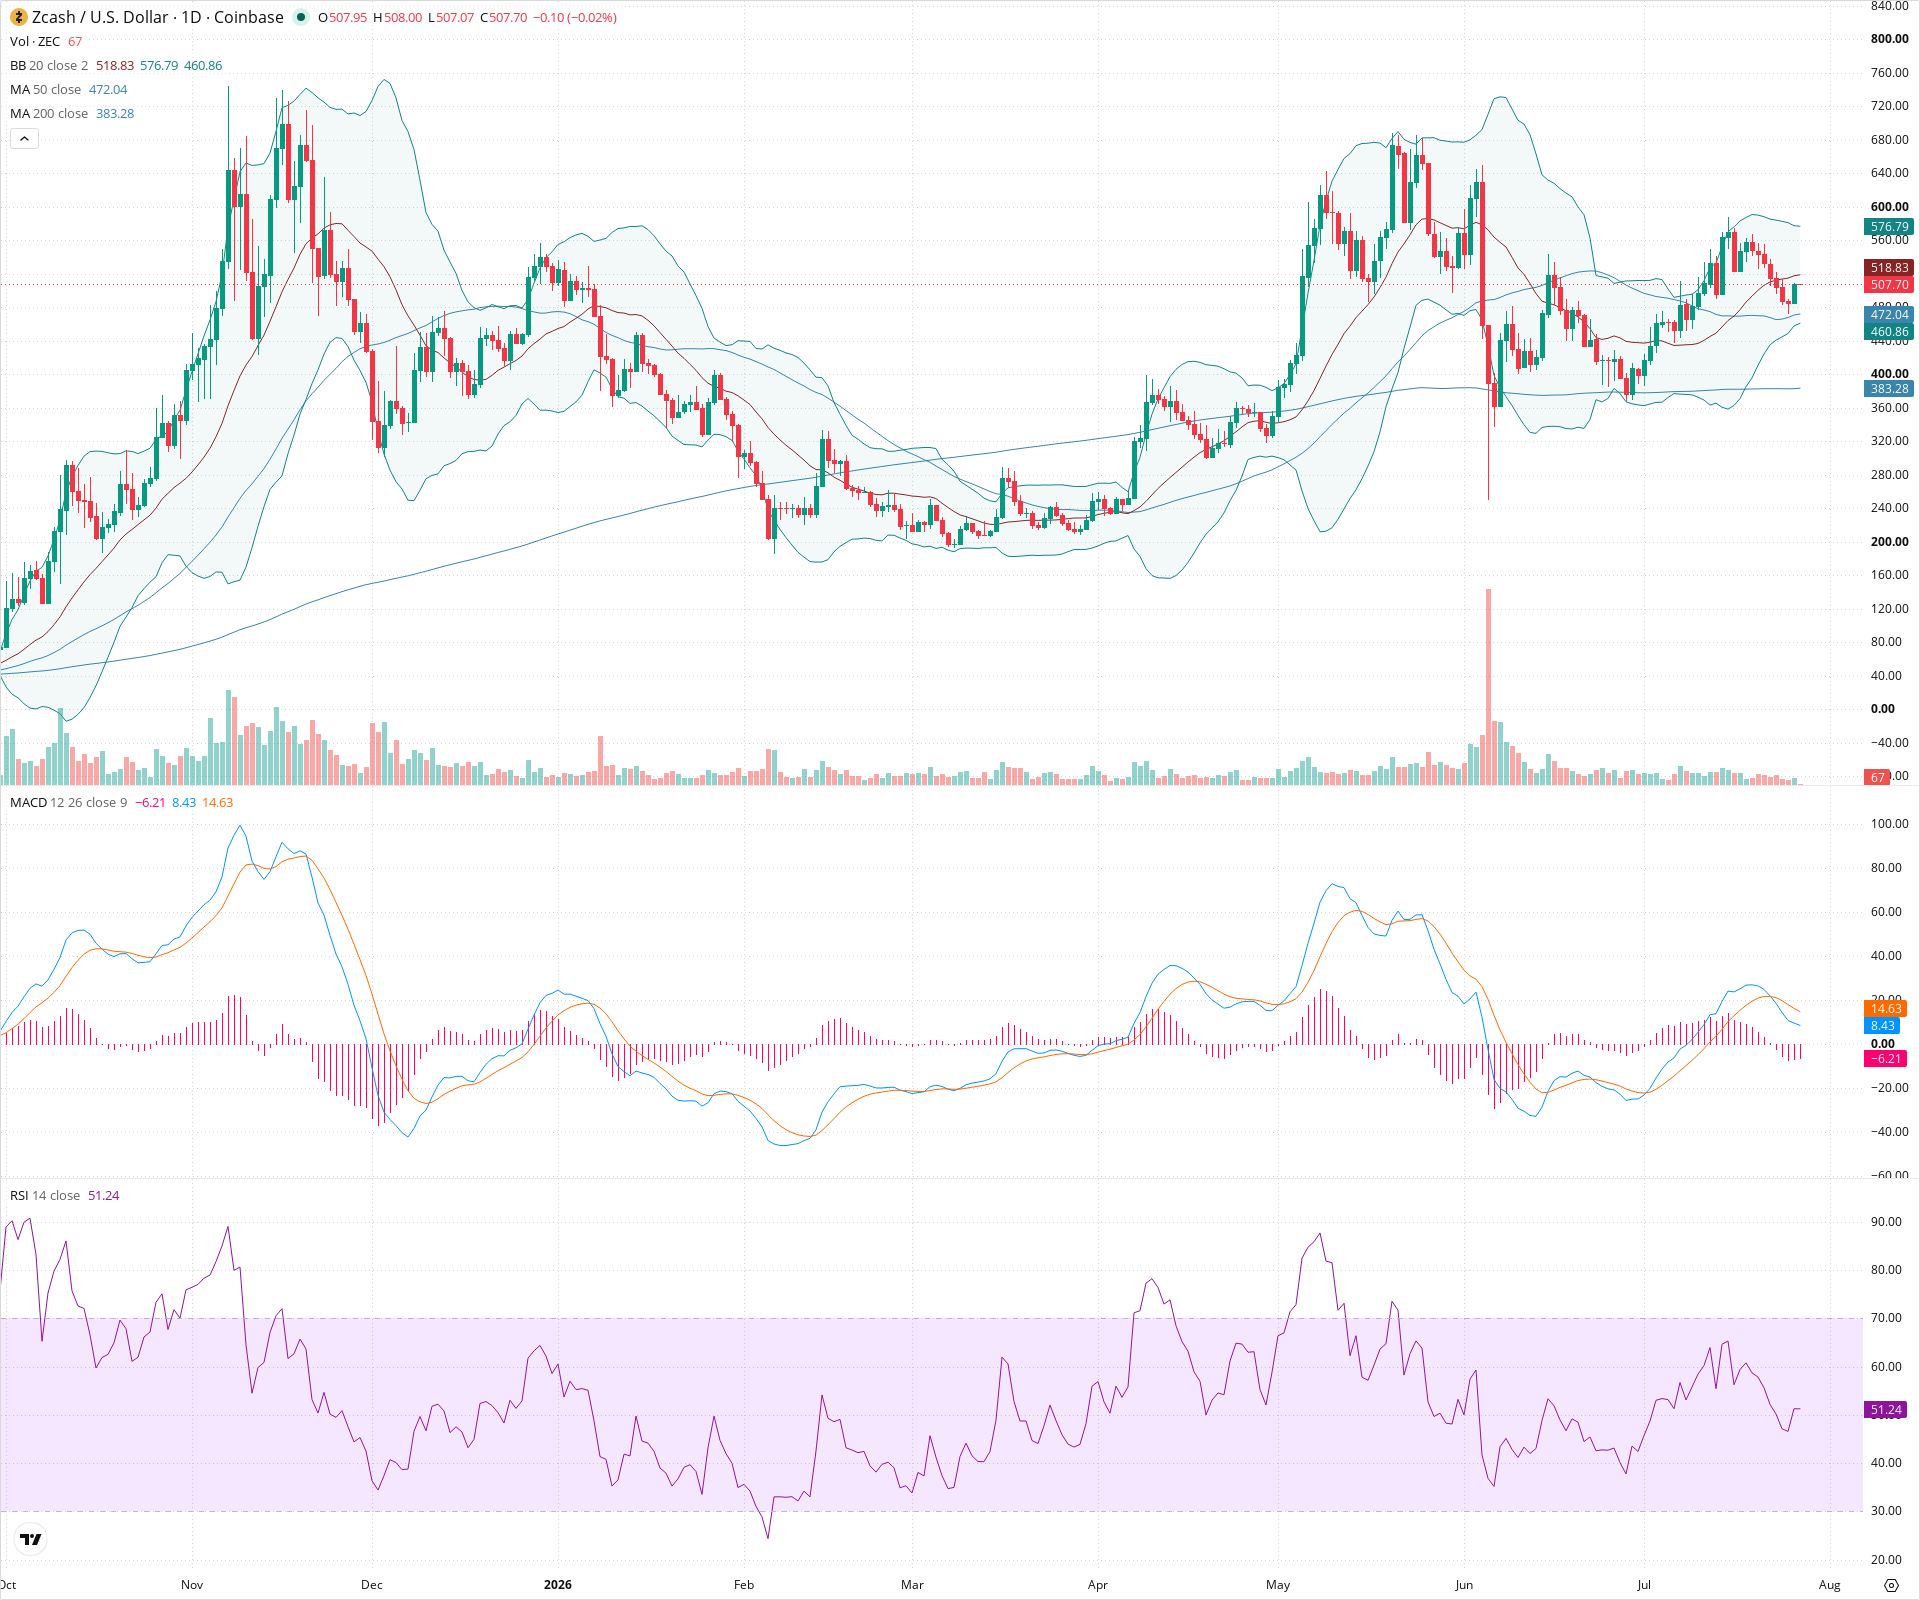
ZEC maintains a bullish long-term posture, characterized by an ascending structure and price action holding above rising 50-day and 200-day SMAs. In the short term, the asset is undergoing a typical correction, facing bearish momentum signaled by a recent MACD crossover and rejection at the $580 resistance level. Long-term investors should monitor the $460-$480 support zone to see if the macro trend holds during this pullback.
Included In Lists
Related Tickers of Interest
ZEC Daily Chart
Sentiment
Short-term Sentiment (days to weeks): Bearish
Price has been rejected from recent highs and is trading below the 20-day SMA. The MACD has just completed a bearish crossover with expanding negative histogram bars, indicating short-term downward momentum.
Long-term Sentiment (weeks to months): Bullish
The broader trend remains positive as the price is sustained comfortably above both the 50-day and 200-day SMAs, which are both sloping upward. The structure of higher lows since March remains intact.
Report Metadata
- Timeframe: daily
- Generated at: 2026-07-27T00:01:55.598Z
- Model: gemini-3.1-pro-preview
Support Price Levels
| Level | Range | Strength | Notes |
|---|---|---|---|
| $470.00 | $460.00 - $480.00 | Strong | Confluence zone of recent structural swing lows and the rising 50-day SMA. |
| $390.00 | $380.00 - $400.00 | Strong | Major structural support zone established during prior consolidations, aligning closely with the 200-day SMA. |
Resistance Price Levels
| Level | Range | Strength | Notes |
|---|---|---|---|
| $570.00 | $560.00 - $580.00 | Strong | Recent swing high zone where price action was sharply rejected, aligning with the upper Bollinger Band area. |
| $735.00 | $720.00 - $750.00 | Strong | Major historical peak zone from late last year representing significant overhead supply. |
Potential Chart Patterns in Formation
| Strength | Pattern | Signal | Target | Details |
|---|---|---|---|---|
| Strong | Ascending Trend Structure | Bullish | N/A | A broad pattern of higher highs and higher lows established since the Q1 bottom, defining the current macro uptrend. |
Frequently Asked Questions about ZEC
What is the current sentiment for ZEC?
The short-term sentiment for ZEC is currently Bearish because Price has been rejected from recent highs and is trading below the 20-day SMA. The MACD has just completed a bearish crossover with expanding negative histogram bars, indicating short-term downward momentum.. The long-term trend is classified as Bullish.
What are the key support levels for ZEC?
StockDips.AI has identified key support levels for ZEC at $470.00 and $390.00. These levels may represent potential accumulation zones where buying interest could emerge.
Is ZEC in a significant dip or a Value Dip right now?
ZEC has a Value Score of 67/100. It is not currently flagged as a significant dip in the Top Dips list. It is not listed as a Value Dip because the long-term sentiment or value-score threshold does not qualify.
View the full interactive analysis on StockDips.AI.