SOL Daily Technical Analysis
Solana
High-performance blockchain supporting fast and inexpensive decentralized apps and NFTs.
SOL Technical Analysis Summary
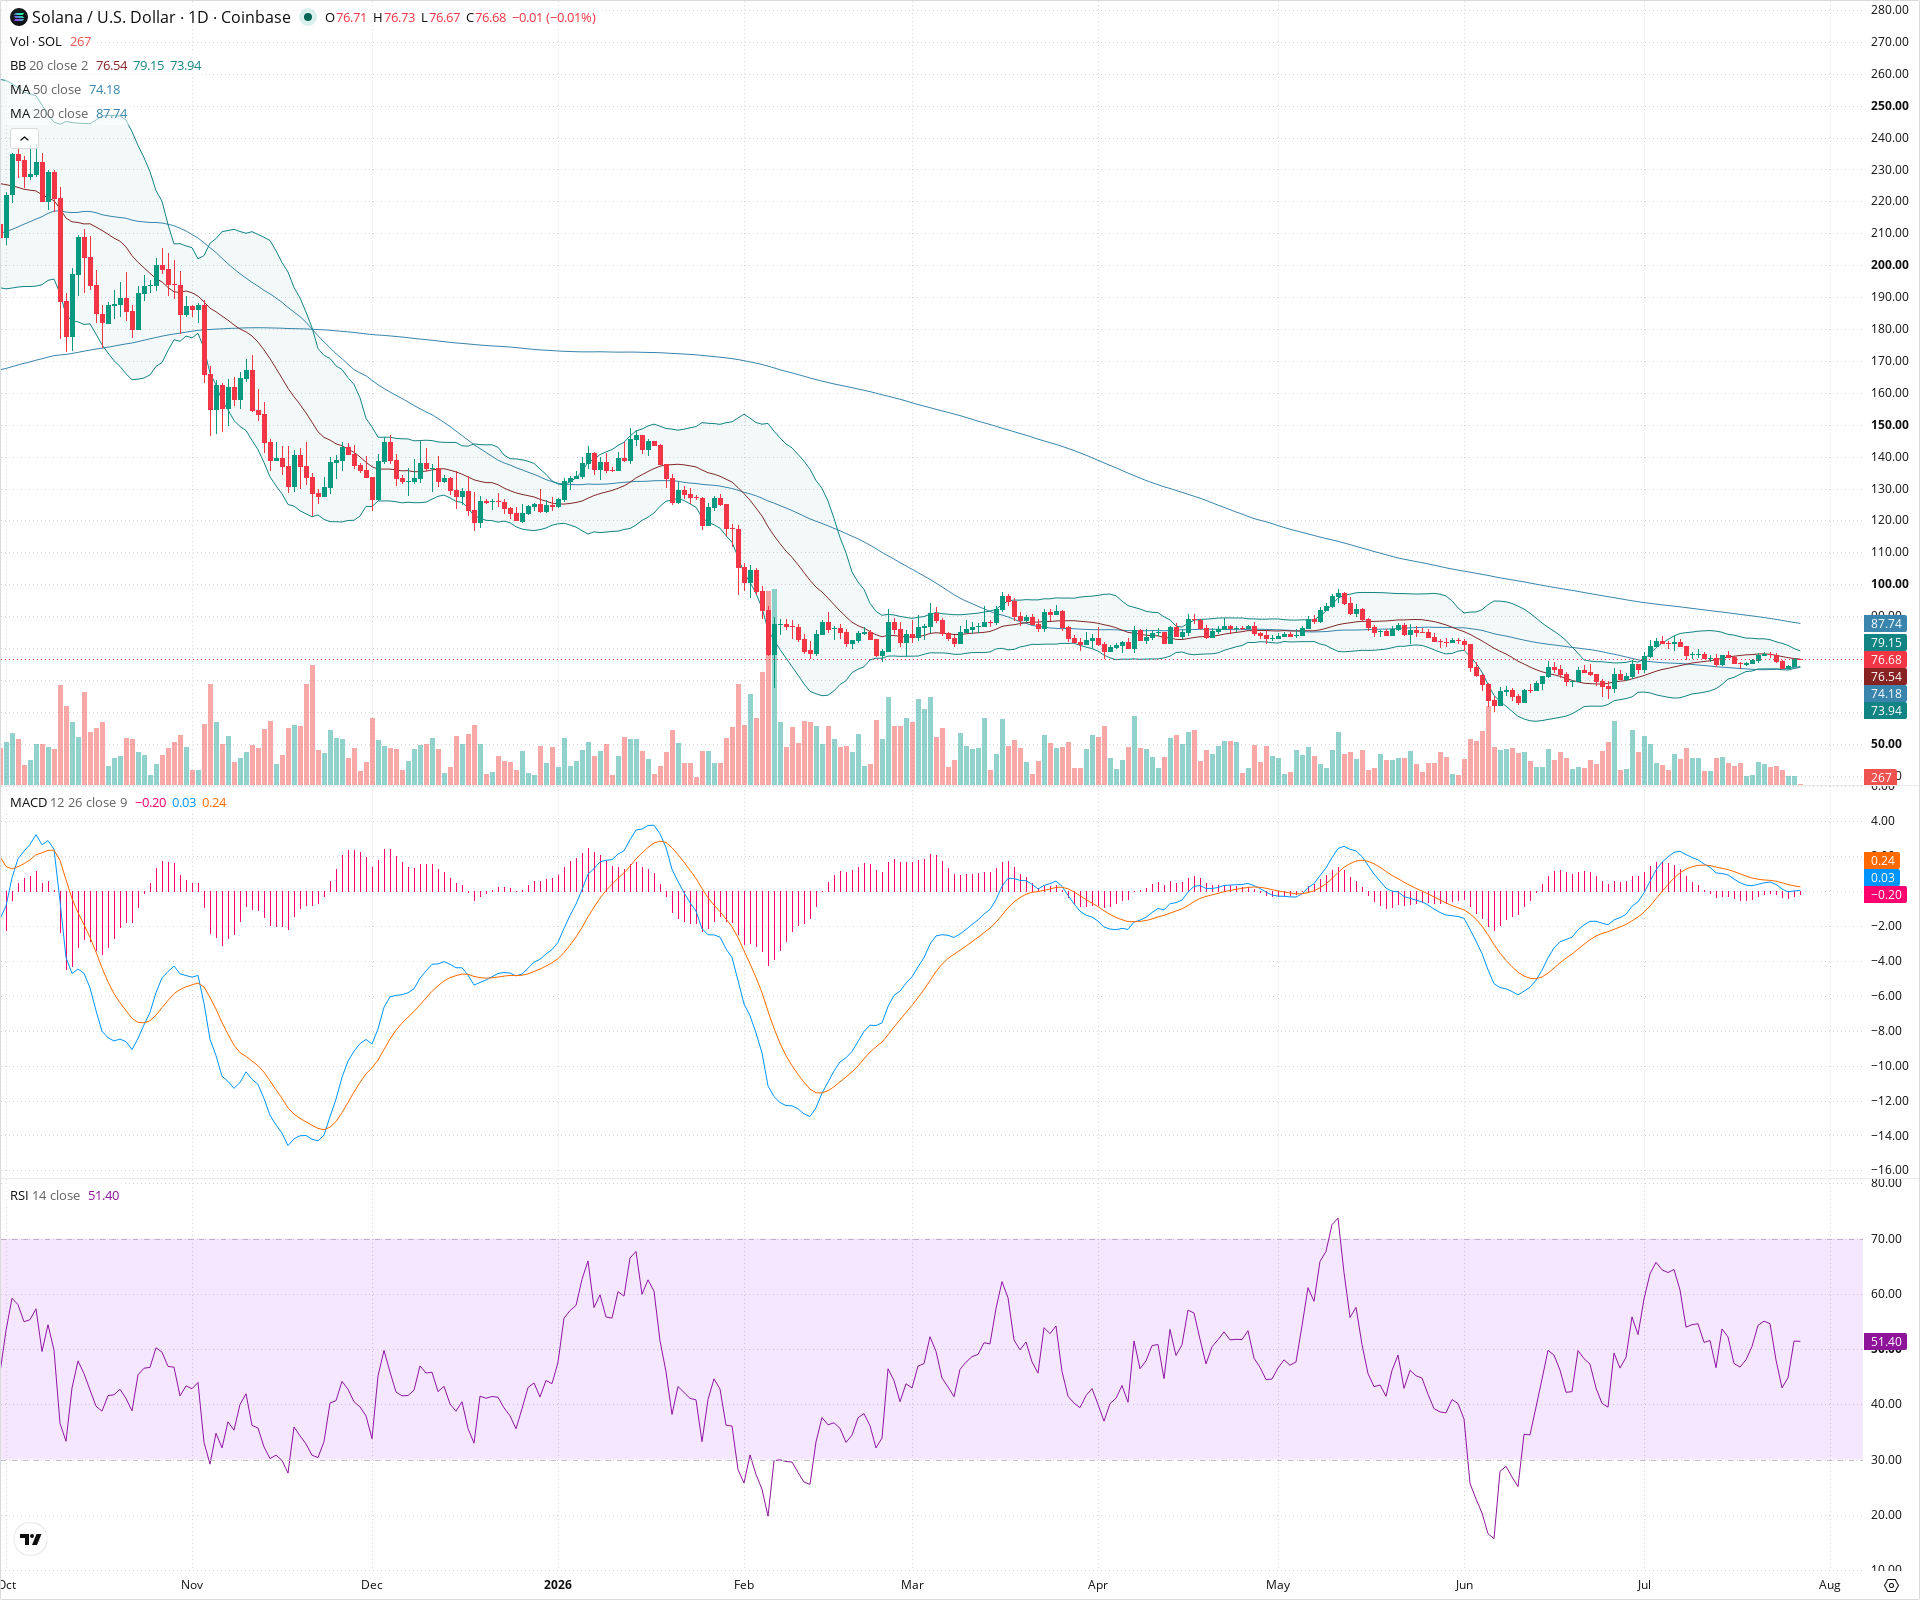
SOL is currently in a long-term downtrend, evidenced by the bearish alignment of the 50-day and 200-day moving averages. However, short-term price action has stabilized into a consolidation phase between these two averages. Momentum indicators (RSI and MACD) are largely neutral, reflecting this sideways movement. A decisive breakout above the 200-day SMA or a breakdown below recent support is needed to dictate the next significant directional move.
Included In Lists
Related Tickers of Interest
SOL Daily Chart
Sentiment
Short-term Sentiment (days to weeks): Neutral
Price is consolidating within a narrow range between the 50-day and 200-day SMAs. MACD histogram is negative but flat, and RSI is near the 50 level, indicating a lack of clear momentum.
Long-term Sentiment (weeks to months): Bearish
The 50-day SMA is below the 200-day SMA (death cross), and both moving averages are sloping downward, suggesting an established long-term downtrend.
Report Metadata
- Timeframe: daily
- Generated at: 2026-07-27T00:00:52.598Z
- Model: gemini-3.1-pro-preview
Support Price Levels
| Level | Range | Strength | Notes |
|---|---|---|---|
| $73.00 | $72.00 - $74.00 | Weak | Recent consolidation low and proximity to the 50-day SMA. |
| $50.00 | $48.00 - $52.00 | Strong | Major swing low established earlier in the year. |
Resistance Price Levels
| Level | Range | Strength | Notes |
|---|---|---|---|
| $87.50 | $85.00 - $90.00 | Weak | Proximity to the 200-day SMA and recent swing highs. |
| $102.50 | $100.00 - $105.00 | Strong | Significant previous breakdown level and psychological resistance. |
Potential Chart Patterns in Formation
| Strength | Pattern | Signal | Target | Details |
|---|---|---|---|---|
| Weak | Consolidation / Rectangle | Neutral | N/A | Price is moving sideways in a defined range after a significant drop, suggesting a period of indecision or accumulation/distribution. |
Frequently Asked Questions about SOL
What is the current sentiment for SOL?
The short-term sentiment for SOL is currently Neutral because Price is consolidating within a narrow range between the 50-day and 200-day SMAs. MACD histogram is negative but flat, and RSI is near the 50 level, indicating a lack of clear momentum.. The long-term trend is classified as Bearish.
What are the key support levels for SOL?
StockDips.AI has identified key support levels for SOL at $73.00 and $50.00. These levels may represent potential accumulation zones where buying interest could emerge.
Is SOL in a significant dip or a Value Dip right now?
SOL has a Value Score of 78/100. It is currently flagged as a significant dip in the Top Dips list. It is not listed as a Value Dip because the long-term sentiment or value-score threshold does not qualify.
View the full interactive analysis on StockDips.AI.