BNB Daily Technical Analysis
Binance Coin
Utility token of the Binance ecosystem, used for transaction fees and blockchain operations.
BNB Technical Analysis Summary
BNB is currently experiencing a period of extreme low volatility, resulting in a tight consolidation phase following a prolonged downtrend. While the short-term picture is neutral as the market awaits a breakout from the Bollinger Band squeeze, the long-term outlook remains bearish as price is firmly capped below key moving averages like the 200-day SMA. A decisive break of the immediate support or resistance levels will likely dictate the next significant trend direction.
Included In Lists
Related Tickers of Interest
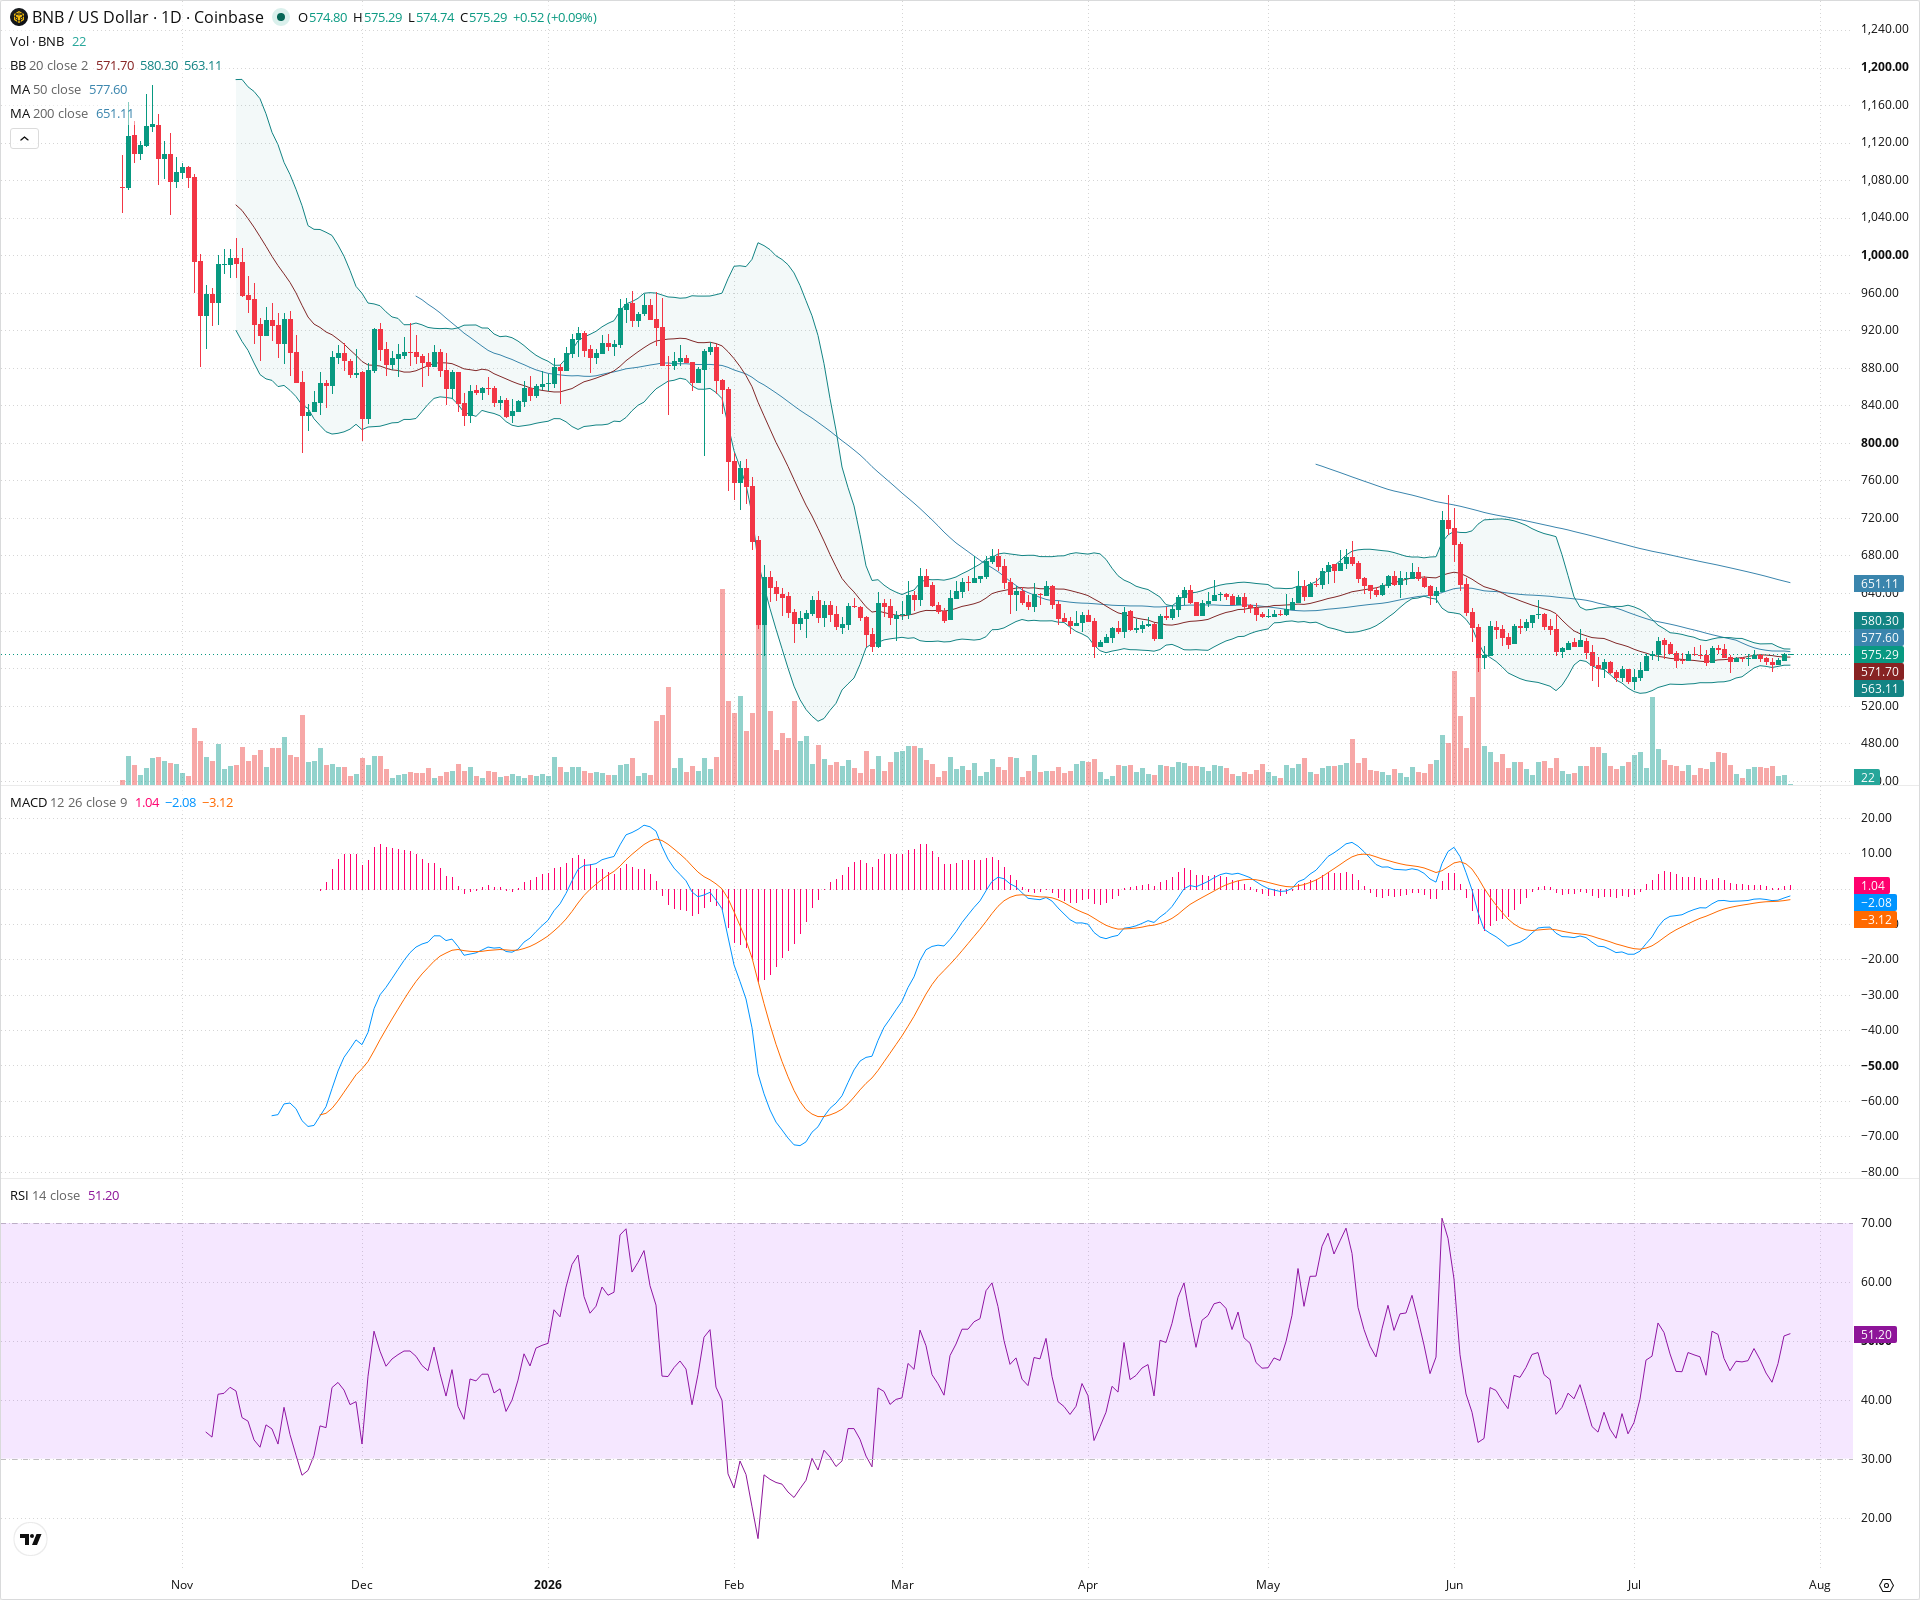
BNB Daily Chart
Sentiment
Short-term Sentiment (days to weeks): Neutral
Price is currently consolidating in a very tight range, caught between the 20-day and 50-day SMAs. Momentum indicators like RSI are flat near 50, and MACD shows minimal divergence, indicating a lack of clear near-term directional bias.
Long-term Sentiment (weeks to months): Bearish
The asset remains in a broader macro downtrend, trading significantly below a downward-sloping 200-day SMA. The market structure continues to exhibit lower highs over the past several months.
Report Metadata
- Timeframe: daily
- Generated at: 2026-07-27T00:02:56.108Z
- Model: gemini-3.1-pro-preview
Support Price Levels
| Level | Range | Strength | Notes |
|---|---|---|---|
| $565.00 | $560.00 - $570.00 | Weak | Immediate support zone defined by the lows of the current tight consolidation phase. |
| $530.00 | $520.00 - $540.00 | Strong | Major historical support floor established by the extreme swing lows in February and retested during the June sell-off. |
Resistance Price Levels
| Level | Range | Strength | Notes |
|---|---|---|---|
| $600.00 | $590.00 - $610.00 | Weak | Immediate overhead resistance marking the top of the current consolidation box and aligning with prior minor peaks. |
| $650.00 | $640.00 - $660.00 | Strong | Significant resistance zone clustering around the declining 200-day SMA and a previous support-turned-resistance area. |
Potential Chart Patterns in Formation
| Strength | Pattern | Signal | Target | Details |
|---|---|---|---|---|
| Strong | Bollinger Band Squeeze | Neutral | N/A | The Bollinger Bands have contracted significantly around the current price action, indicating a period of abnormally low volatility. |
| Weak | Short-term Descending Triangle | Bearish | N/A | A series of lower highs has formed since mid-June against a relatively flat horizontal support base near the 560 level. |
Frequently Asked Questions about BNB
What is the current sentiment for BNB?
The short-term sentiment for BNB is currently Neutral because Price is currently consolidating in a very tight range, caught between the 20-day and 50-day SMAs. Momentum indicators like RSI are flat near 50, and MACD shows minimal divergence, indicating a lack of clear near-term directional bias.. The long-term trend is classified as Bearish.
What are the key support levels for BNB?
StockDips.AI has identified key support levels for BNB at $565.00 and $530.00. These levels may represent potential accumulation zones where buying interest could emerge.
Is BNB in a significant dip or a Value Dip right now?
BNB has a Value Score of 79/100. It is currently flagged as a significant dip in the Top Dips list. It is not listed as a Value Dip because the long-term sentiment or value-score threshold does not qualify.
View the full interactive analysis on StockDips.AI.