BNB Weekly Technical Analysis
Binance Coin
Utility token of the Binance ecosystem, used for transaction fees and blockchain operations.
BNB Technical Analysis Summary
BNB is in a severe long-term downtrend following a parabolic top and subsequent collapse. Current weekly price action is bearish, characterized by weak consolidation below key moving averages and declining momentum indicators. While MACD shows a deceleration of downward momentum, the overall structure heavily favors sellers until the $610-$620 resistance zone can be reclaimed.
Included In Lists
Related Tickers of Interest
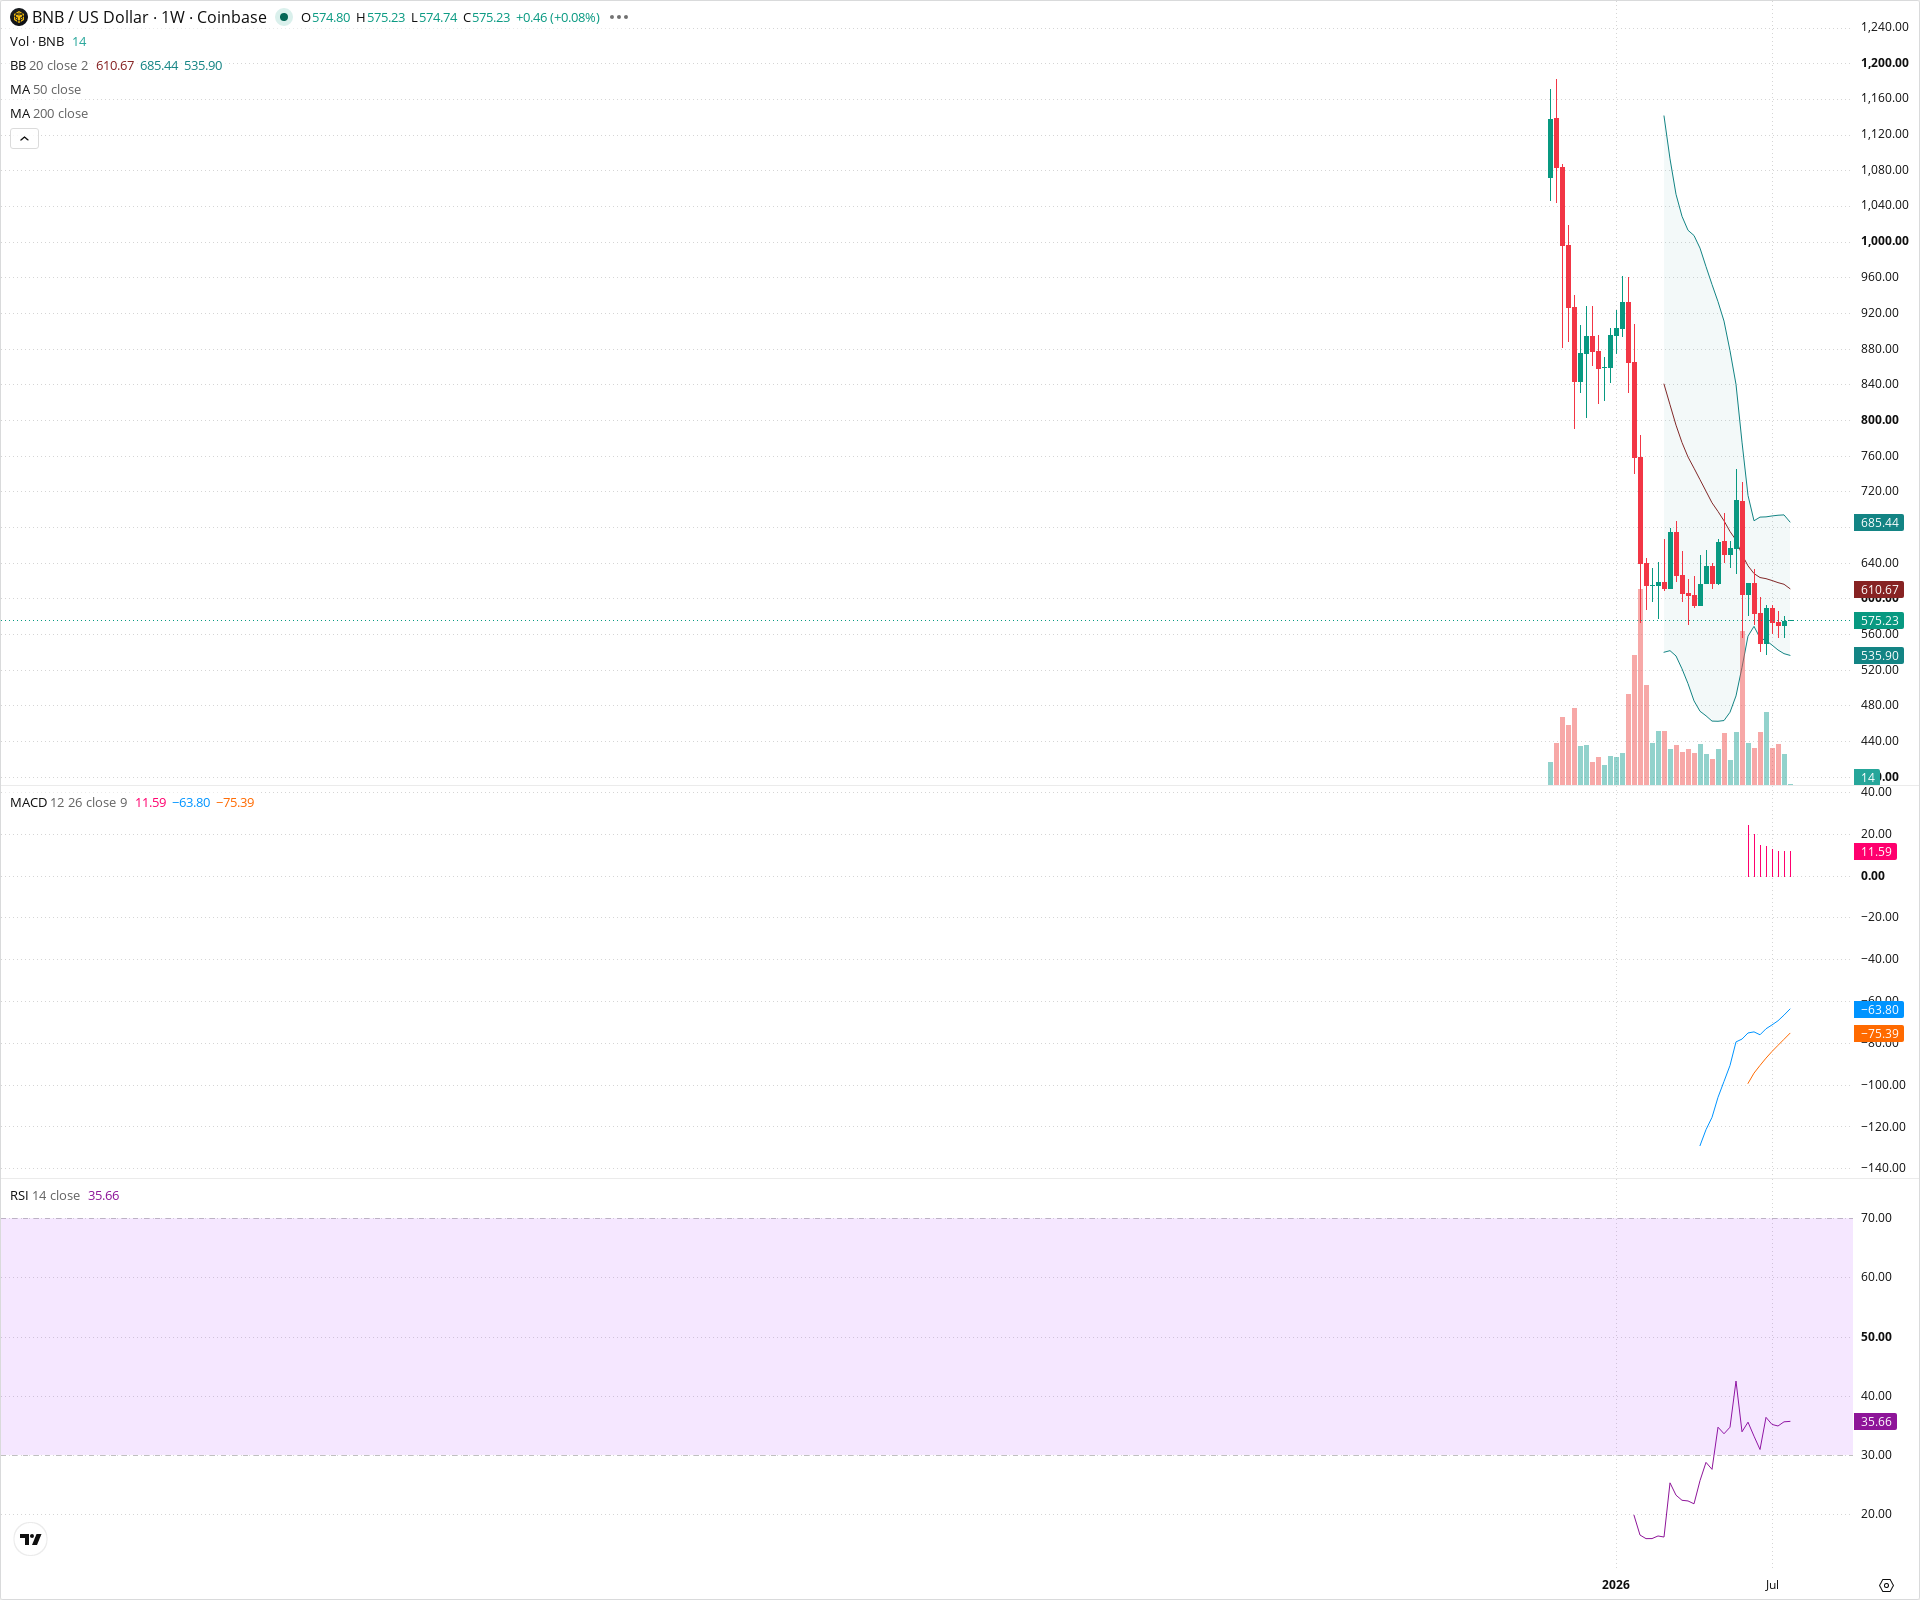
BNB Weekly Chart
Sentiment
Short-term Sentiment (days to weeks): Bearish
Price is trading weakly in the lower portion of its recent range, remaining below the declining 20-week moving average (middle Bollinger Band) with RSI declining towards oversold territory.
Long-term Sentiment (weeks to months): Bearish
The chart displays a massive structural breakdown from all-time highs, followed by a severe crash. The subsequent price action is a weak, low-level consolidation below a steeply declining moving average, indicating persistent long-term selling pressure.
Report Metadata
- Timeframe: weekly
- Generated at: 2026-07-27T00:02:12.099Z
- Model: gemini-3.1-pro-preview
Support Price Levels
| Level | Range | Strength | Notes |
|---|---|---|---|
| $530.00 | $520.00 - $540.00 | Strong | Recent significant swing low established after the major crash, coinciding with the lower Bollinger Band. |
Resistance Price Levels
| Level | Range | Strength | Notes |
|---|---|---|---|
| $612.50 | $605.00 - $620.00 | Strong | Confluence of the 20-week SMA (middle Bollinger Band) and recent minor structural breakdown levels. |
| $702.50 | $685.00 - $720.00 | Strong | Recent consolidation swing highs and the upper Bollinger Band. |
Potential Chart Patterns in Formation
| Strength | Pattern | Signal | Target | Details |
|---|---|---|---|---|
| Strong | Bearish Consolidation | Bearish | N/A | Following a massive downward thrust, price is consolidating weakly near the lows, forming lower highs. This typically precedes continuation of the prior downtrend. |
Frequently Asked Questions about BNB
What is the current sentiment for BNB?
The short-term sentiment for BNB is currently Bearish because Price is trading weakly in the lower portion of its recent range, remaining below the declining 20-week moving average (middle Bollinger Band) with RSI declining towards oversold territory.. The long-term trend is classified as Bearish.
What are the key support levels for BNB?
StockDips.AI has identified key support levels for BNB at $530.00. These levels may represent potential accumulation zones where buying interest could emerge.
Is BNB in a significant dip or a Value Dip right now?
BNB has a Value Score of 78/100. It is currently flagged as a significant dip in the Top Dips list. It is not listed as a Value Dip because the long-term sentiment or value-score threshold does not qualify.
View the full interactive analysis on StockDips.AI.