BTC Weekly Technical Analysis
Bitcoin
The first and largest cryptocurrency, created as decentralized digital money with a capped supply of 21 million coins.
BTC Technical Analysis Summary
Bitcoin has undergone a severe technical breakdown on the weekly chart, violating a massive multi-year top formation. The price has plummeted below key moving averages and is currently clinging to support near the 200-week SMA. Given the extensive technical damage, the long-term posture has shifted decisively bearish, with major overhead resistance likely to cap any short-term relief rallies.
Included In Lists
Related Tickers of Interest
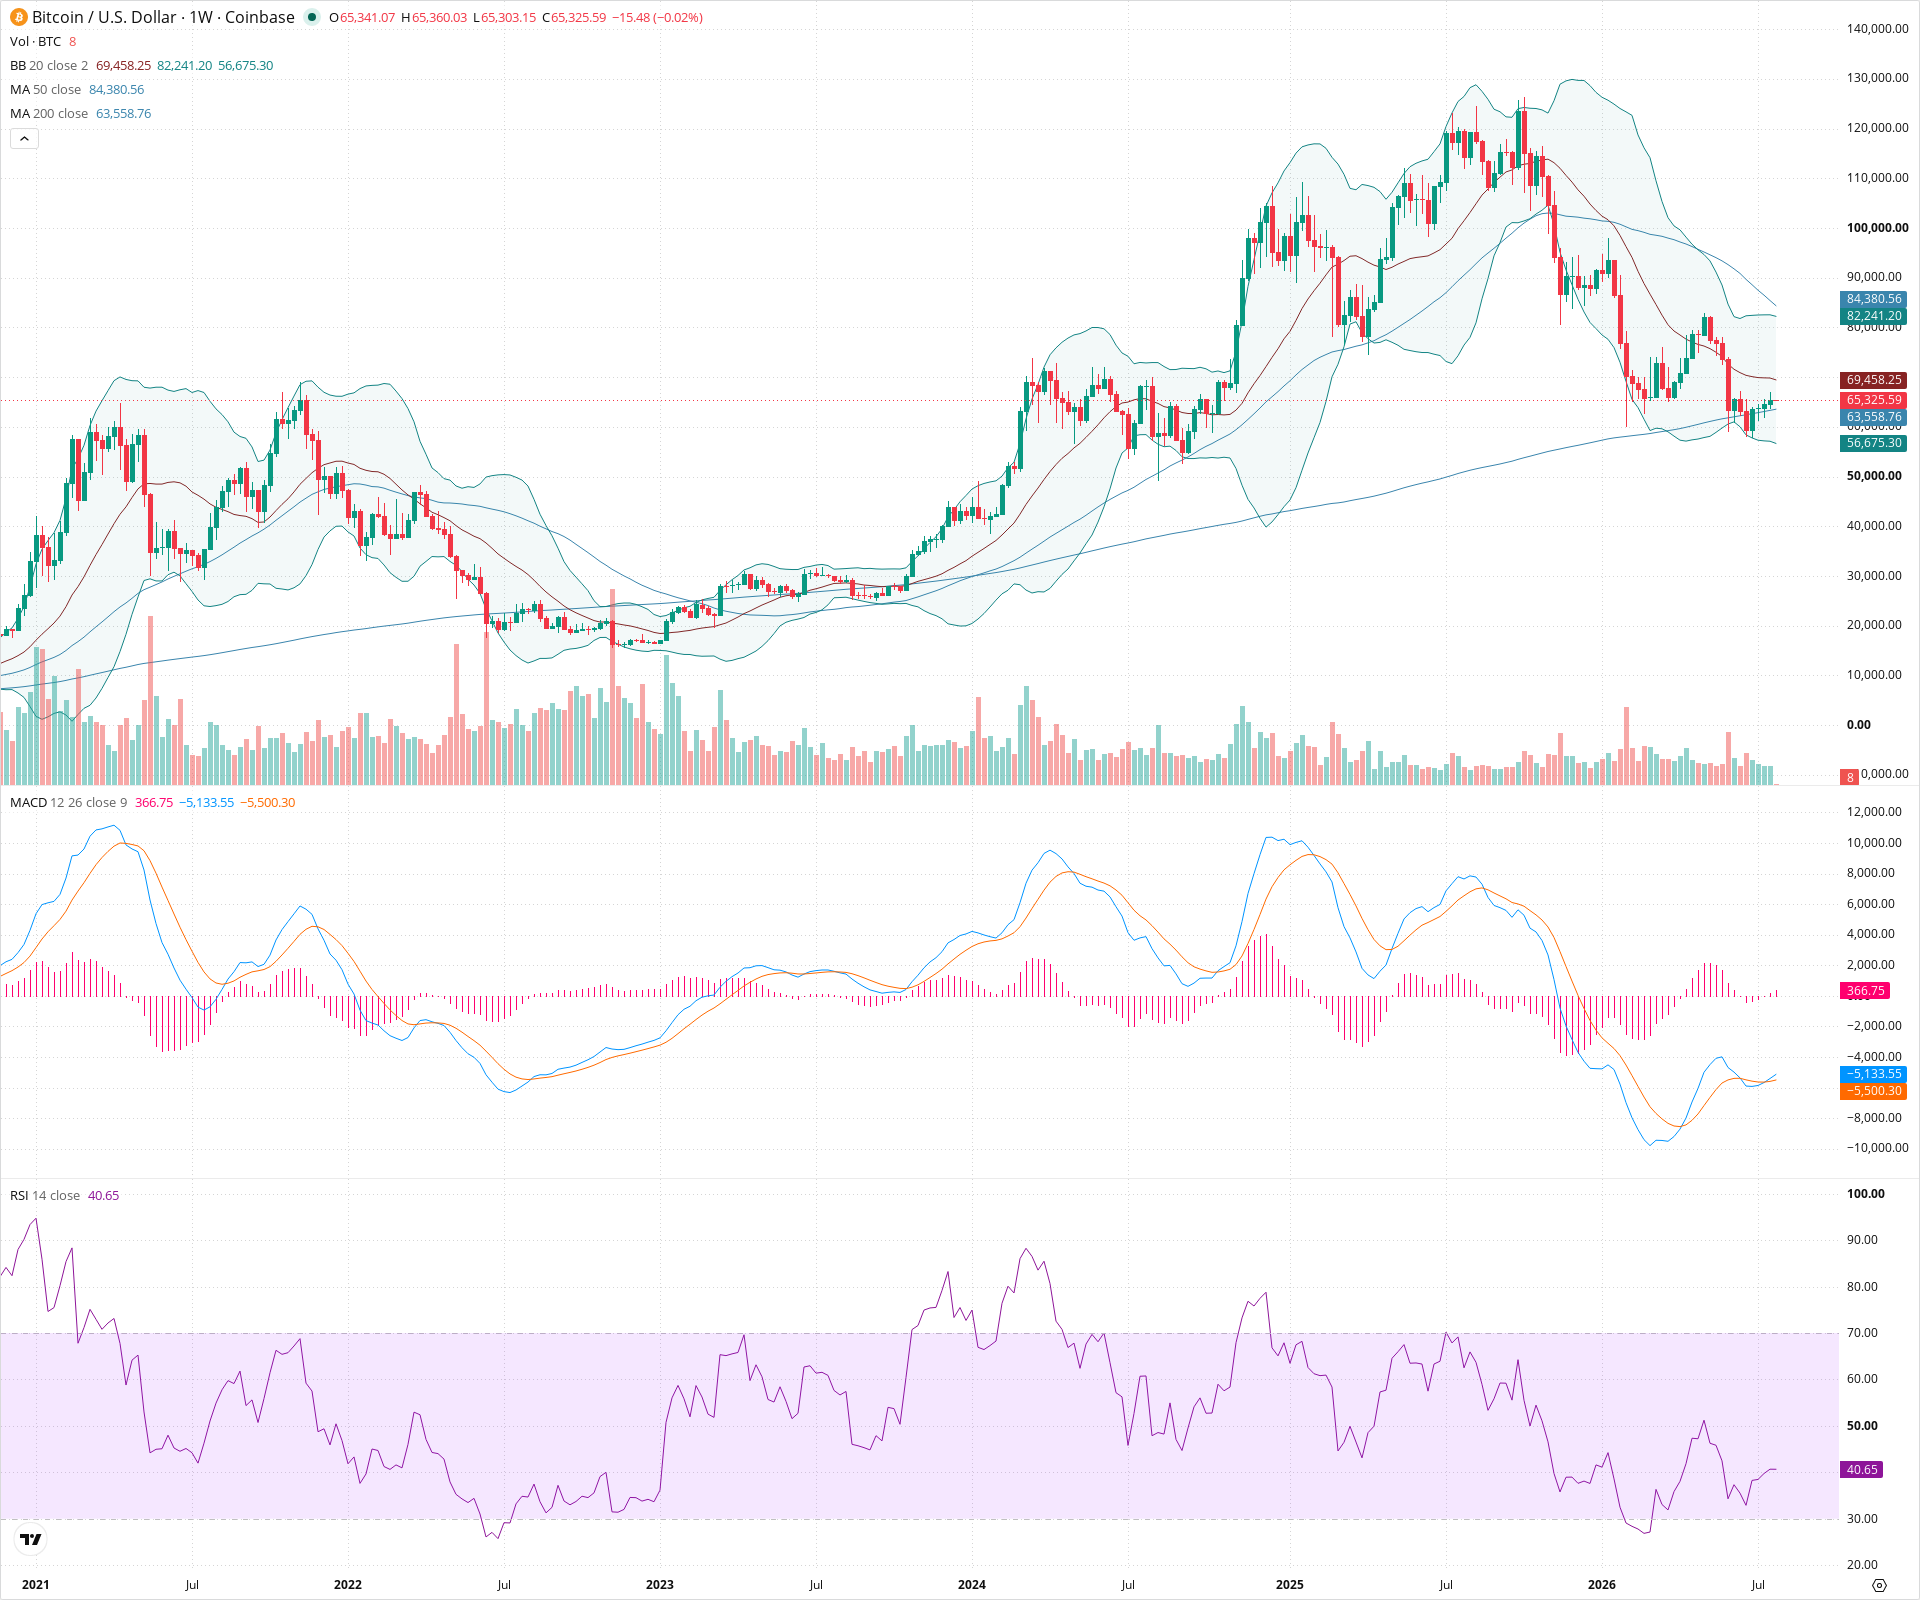
BTC Weekly Chart
Sentiment
Short-term Sentiment (days to weeks): Bearish
Price has experienced a sharp, high-volume breakdown, breaking below both the 20-week and 50-week SMAs. RSI is in bearish territory below 50, and MACD lines are deeply negative, though the histogram shows a slight deceleration of downside momentum as price tests the 200-week SMA.
Long-term Sentiment (weeks to months): Bearish
A massive, multi-year top structure appears to have decisively broken down. The long-term uptrend has suffered significant technical damage with the loss of the 50-week SMA and major structural support levels.
Report Metadata
- Timeframe: weekly
- Generated at: 2026-07-27T00:01:52.099Z
- Model: gemini-3.1-pro-preview
Support Price Levels
| Level | Range | Strength | Notes |
|---|---|---|---|
| $59,250.00 | $55,000.00 - $63,500.00 | Strong | Current support zone defined by recent breakdown lows and the 200-week SMA. |
| $28,000.00 | $25,000.00 - $31,000.00 | Strong | Major historical long-term consolidation base. |
Resistance Price Levels
| Level | Range | Strength | Notes |
|---|---|---|---|
| $82,500.00 | $80,000.00 - $85,000.00 | Strong | Major prior support zone now acting as strong overhead resistance, converging with the declining 50-week SMA. |
| $105,000.00 | $100,000.00 - $110,000.00 | Strong | Lower high resistance zone established during the final stages of the topping pattern. |
Potential Chart Patterns in Formation
| Strength | Pattern | Signal | Target | Details |
|---|---|---|---|---|
| Strong | Massive Top Breakdown | Bearish | N/A | Price broke aggressively downward through the 'neckline' support of a large, complex multi-year distribution top. |
Frequently Asked Questions about BTC
What is the current sentiment for BTC?
The short-term sentiment for BTC is currently Bearish because Price has experienced a sharp, high-volume breakdown, breaking below both the 20-week and 50-week SMAs. RSI is in bearish territory below 50, and MACD lines are deeply negative, though the histogram shows a slight deceleration of downside momentum as price tests the 200-week SMA.. The long-term trend is classified as Bearish.
What are the key support levels for BTC?
StockDips.AI has identified key support levels for BTC at $59,250.00 and $28,000.00. These levels may represent potential accumulation zones where buying interest could emerge.
Is BTC in a significant dip or a Value Dip right now?
BTC has a Value Score of 72/100. It is currently flagged as a significant dip in the Top Dips list. It is not listed as a Value Dip because the long-term sentiment or value-score threshold does not qualify.
View the full interactive analysis on StockDips.AI.