TRX Daily Technical Analysis
Tron
TRON (TRX) is a decentralized blockchain platform for content sharing and dApps, aiming to create a free digital entertainment ecosystem; TRX is its native utility token used for transactions, governance (staking/voting), and powering the network, known for high throughput and low fees.
TRX Technical Analysis Summary
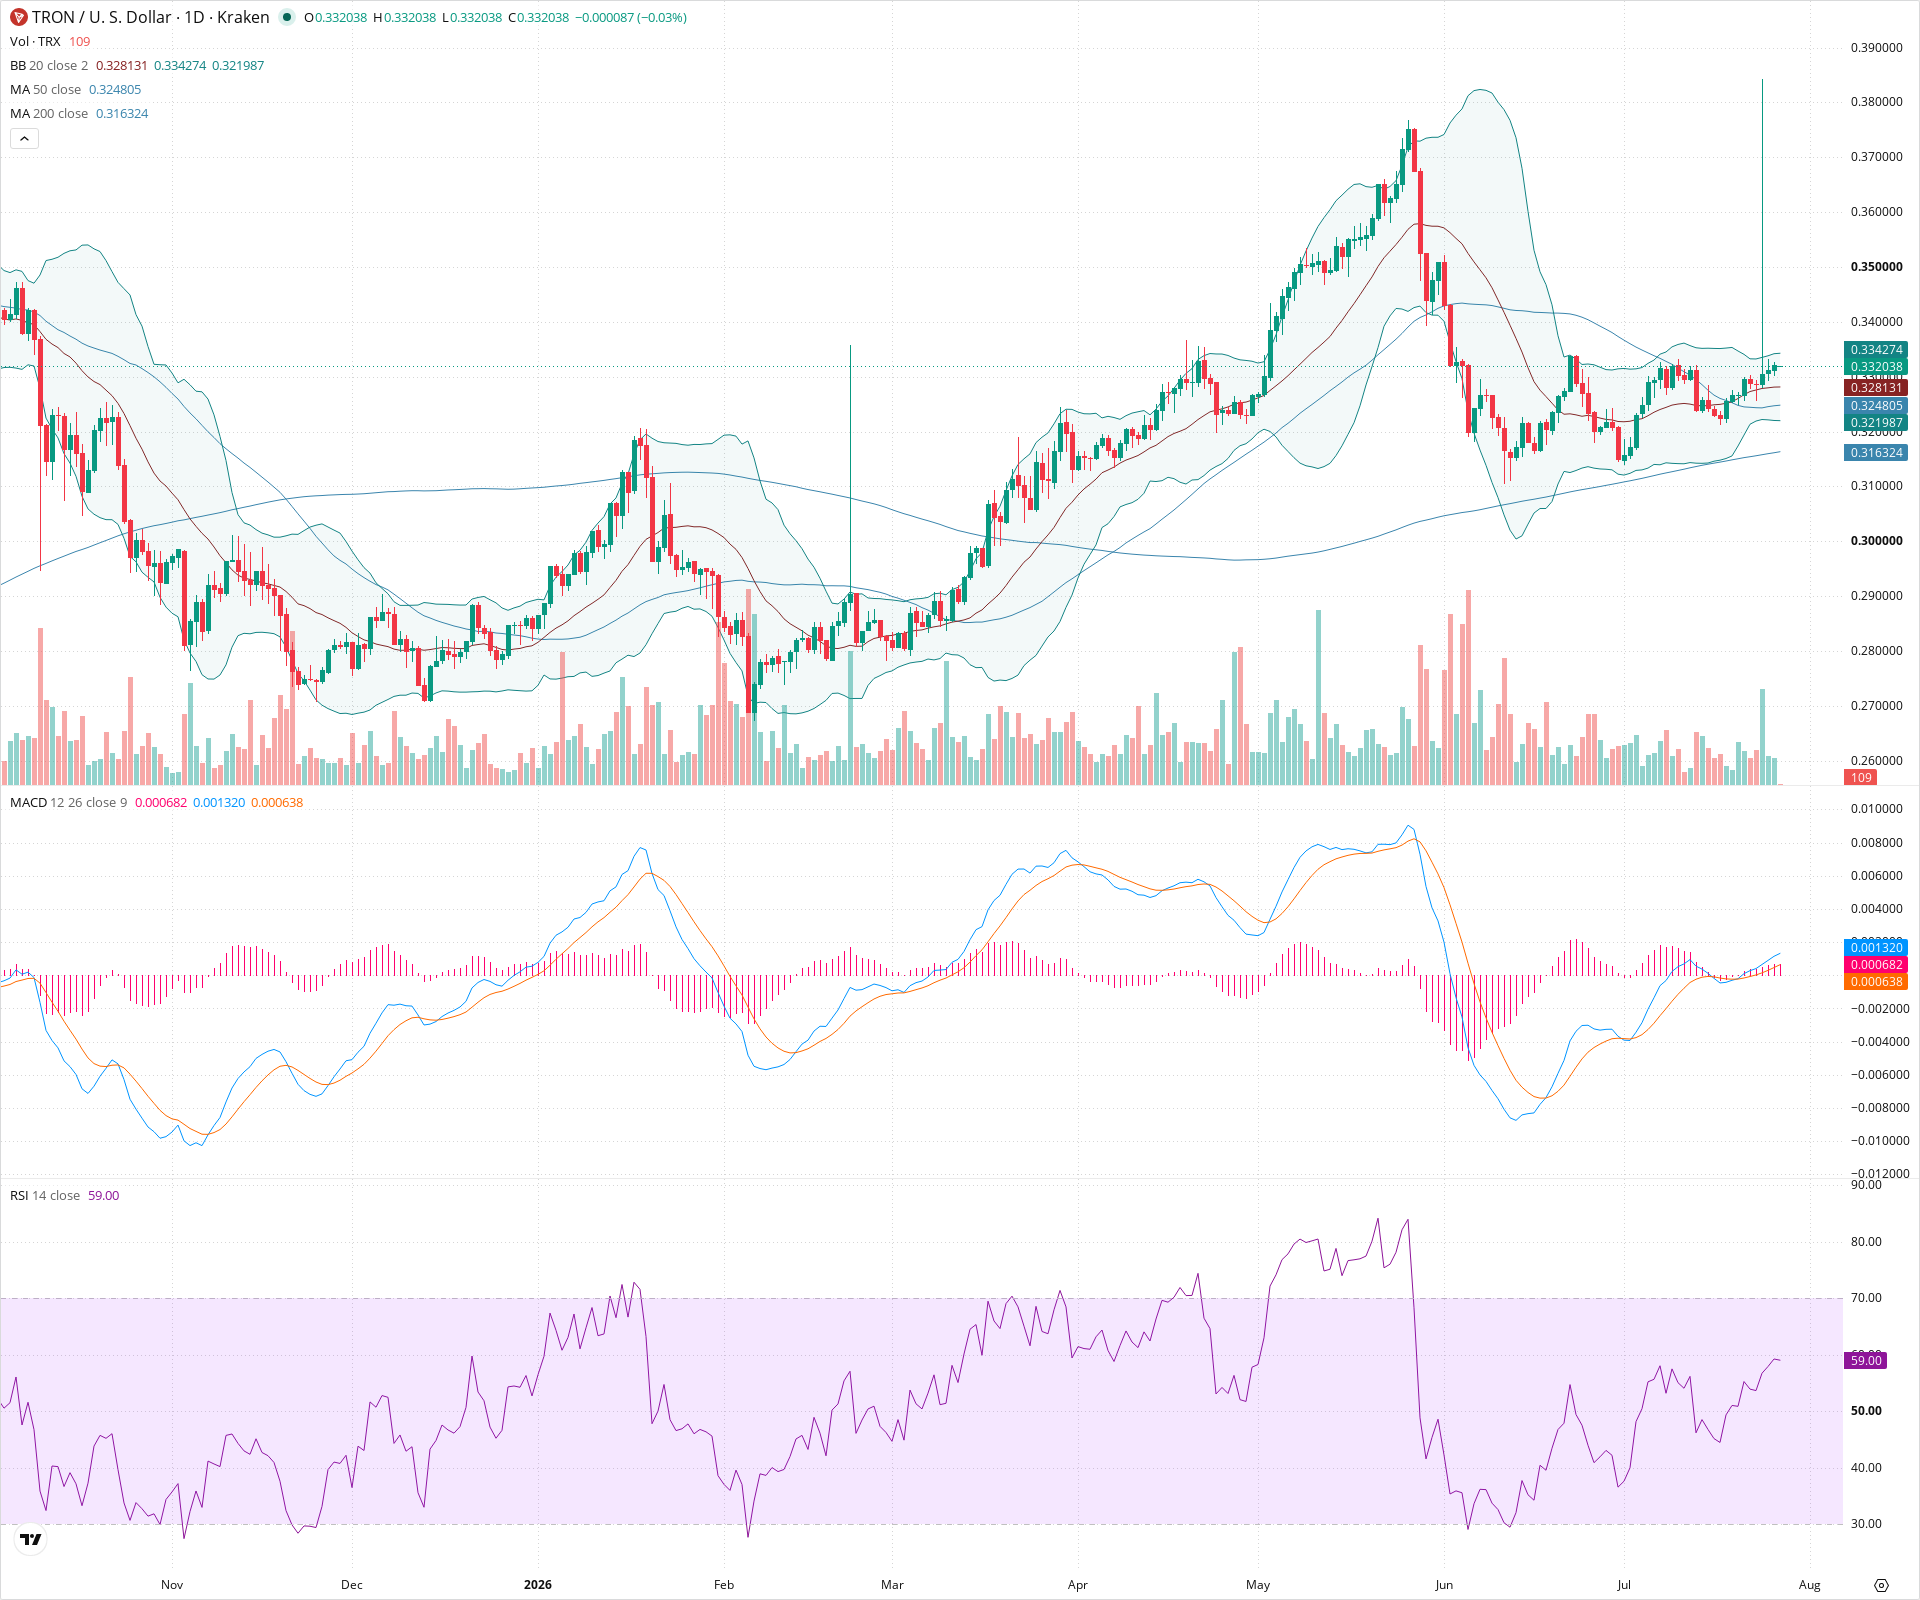
TRX is demonstrating a solid recovery after a deep correction tested the 200-day moving average. The recent price action, combined with a bullish MACD crossover and a climbing RSI, indicates a revival in short-term upward momentum. As long as the primary support around the 200-day SMA is maintained, the long-term bullish market structure remains intact.
Included In Lists
Related Tickers of Interest
TRX Daily Chart
Sentiment
Short-term Sentiment (days to weeks): Bullish
Price has reclaimed the 20-day and 50-day moving averages, supported by a bullish MACD crossover with an expanding positive histogram and RSI rising near 59.
Long-term Sentiment (weeks to months): Bullish
The price remains above a rising 200-day moving average, maintaining a long-term higher high structure despite the recent deep pullback.
Report Metadata
- Timeframe: daily
- Generated at: 2026-07-27T00:01:16.398Z
- Model: gemini-3.1-pro-preview
Support Price Levels
| Level | Range | Strength | Notes |
|---|---|---|---|
| $0.33 | $0.32 - $0.33 | Strong | Confluence of the 20-day and 50-day simple moving averages acting as immediate dynamic support. |
| $0.31 | $0.31 - $0.32 | Strong | Recent major swing low zone aligning closely with the 200-day simple moving average. |
Resistance Price Levels
| Level | Range | Strength | Notes |
|---|---|---|---|
| $0.34 | $0.34 - $0.34 | Weak | Near-term minor swing high and proximity to the upper Bollinger Band. |
| $0.38 | $0.37 - $0.38 | Strong | Major previous swing high peak marking the top of the chart's visible macro rally. |
Potential Chart Patterns in Formation
| Strength | Pattern | Signal | Target | Details |
|---|---|---|---|---|
| Strong | Double Bottom | Bullish | $0.35 | Two distinct bounces off the ~0.310 to ~0.315 support zone (near the 200 SMA) followed by a breakout above the local 50 SMA resistance. |
Frequently Asked Questions about TRX
What is the current sentiment for TRX?
The short-term sentiment for TRX is currently Bullish because Price has reclaimed the 20-day and 50-day moving averages, supported by a bullish MACD crossover with an expanding positive histogram and RSI rising near 59.. The long-term trend is classified as Bullish.
What are the key support levels for TRX?
StockDips.AI has identified key support levels for TRX at $0.33 and $0.31. These levels may represent potential accumulation zones where buying interest could emerge.
Is TRX in a significant dip or a Value Dip right now?
TRX has a Value Score of 107/100. It is not currently flagged as a significant dip in the Top Dips list. It is not listed as a Value Dip because the long-term sentiment or value-score threshold does not qualify.
View the full interactive analysis on StockDips.AI.