DOGE Weekly Technical Analysis
Dogecoin
A meme-inspired cryptocurrency with a strong community and fast transaction times.
DOGE Technical Analysis Summary
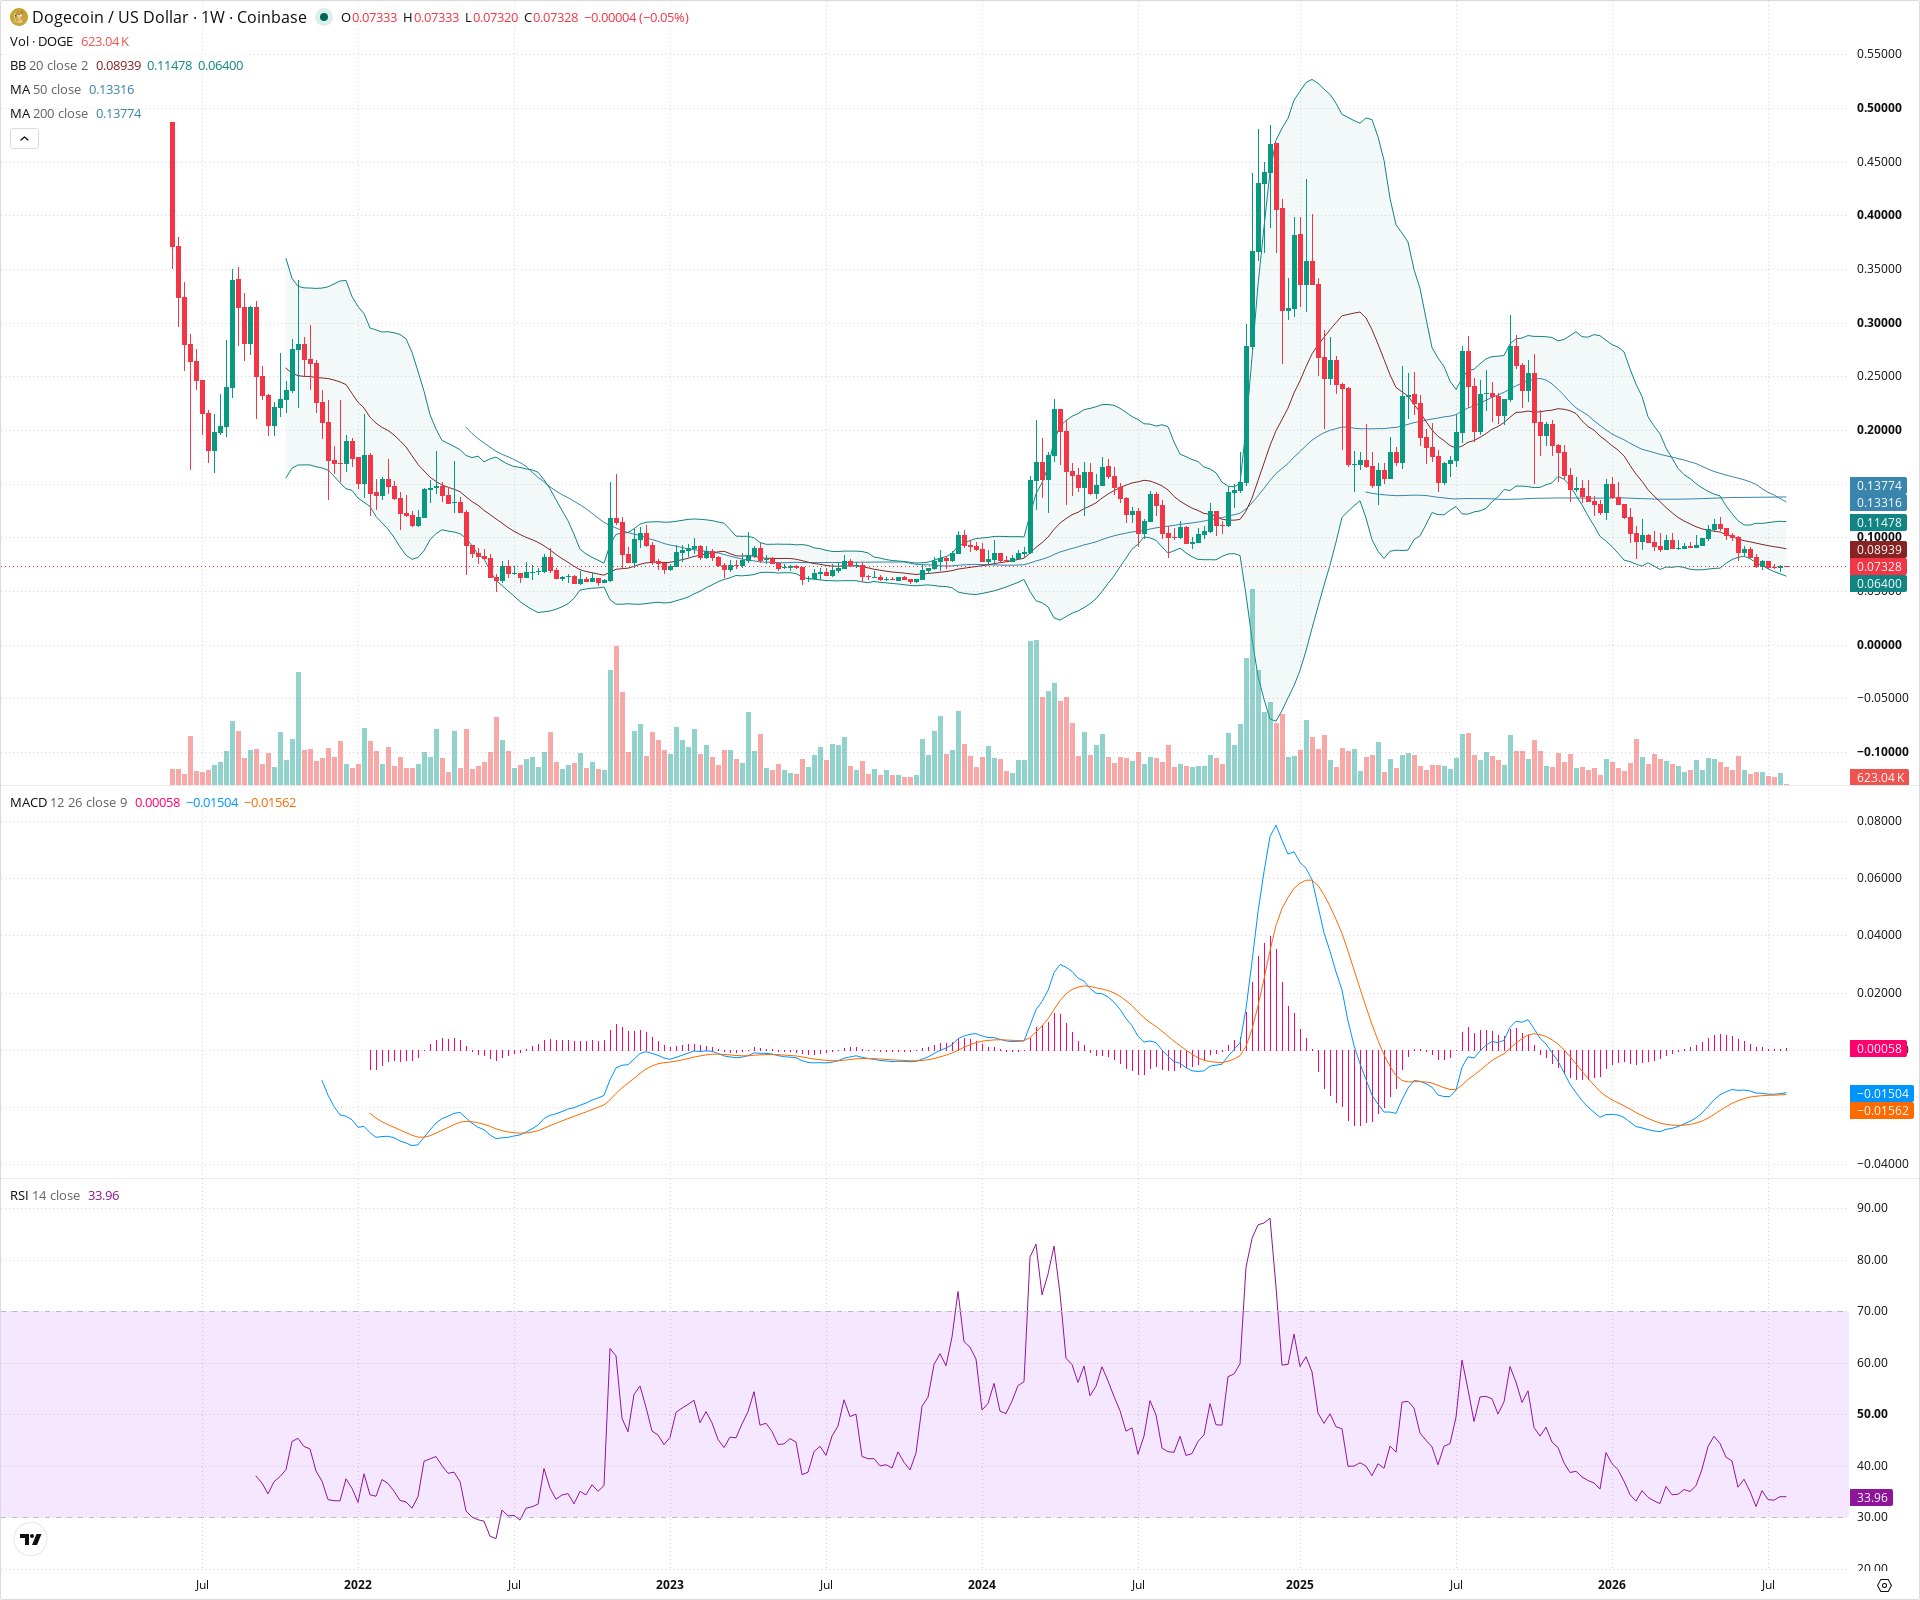
The weekly chart for DOGE presents a firmly bearish technical picture across both short and long timeframes. The asset is trading well below major moving averages and is currently exhibiting strong downward momentum confirmed by MACD expansion. A sustained defense of the current 0.070 region is necessary to prevent further declines toward deeper historical support bases.
Included In Lists
Related Tickers of Interest
DOGE Weekly Chart
Sentiment
Short-term Sentiment (days to weeks): Bearish
Price is actively trending downwards, closing near the lower Bollinger Band. The MACD histogram is expanding negatively below the zero line, confirming strong near-term downward momentum, and RSI is falling towards oversold territory.
Long-term Sentiment (weeks to months): Bearish
The macro structure consists of a prolonged series of lower highs and lower lows since the local peak. The price is trading significantly below the key 50-week and 200-week Simple Moving Averages, indicating a firmly established long-term downtrend.
Report Metadata
- Timeframe: weekly
- Generated at: 2026-07-27T00:03:42.700Z
- Model: gemini-3.1-pro-preview
Support Price Levels
| Level | Range | Strength | Notes |
|---|---|---|---|
| $0.07 | $0.07 - $0.08 | Weak | Current immediate support zone based on recent local lows and previous minor consolidation. |
| $0.06 | $0.06 - $0.07 | Strong | Historical base and significant consolidation zone visible on the left side of the chart before previous massive run-ups. |
Resistance Price Levels
| Level | Range | Strength | Notes |
|---|---|---|---|
| $0.09 | $0.09 - $0.10 | Strong | Previous support zone that was broken, now acting as resistance, roughly aligning with the 20-week SMA. |
| $0.13 | $0.13 - $0.14 | Strong | Major confluence of resistance containing previous swing highs and the current location of both the 50-week and 200-week SMAs. |
Potential Chart Patterns in Formation
| Strength | Pattern | Signal | Target | Details |
|---|---|---|---|---|
| Strong | Downtrend Structure | Bearish | N/A | A clear, multi-month sequence of lower swing highs and lower swing lows following the failure at higher price levels, defining the current market regime. |
Frequently Asked Questions about DOGE
What is the current sentiment for DOGE?
The short-term sentiment for DOGE is currently Bearish because Price is actively trending downwards, closing near the lower Bollinger Band. The MACD histogram is expanding negatively below the zero line, confirming strong near-term downward momentum, and RSI is falling towards oversold territory.. The long-term trend is classified as Bearish.
What are the key support levels for DOGE?
StockDips.AI has identified key support levels for DOGE at $0.07 and $0.06. These levels may represent potential accumulation zones where buying interest could emerge.
Is DOGE in a significant dip or a Value Dip right now?
DOGE has a Value Score of 58/100. It is not currently flagged as a significant dip in the Top Dips list. It is not listed as a Value Dip because the long-term sentiment or value-score threshold does not qualify.
View the full interactive analysis on StockDips.AI.