EEM Weekly Technical Analysis
Emerging Markets ETF
iShares MSCI Exchange-Traded Fund designed to track the performance of large- and mid-cap stocks across emerging market countries, including China, Taiwan, India, Brazil, and South Africa. Often used as a macro indicator for global risk appetite and emerging-market sentiment.
EEM Technical Analysis Summary
The long-term technical picture for EEM remains bullish as it trades comfortably above rising 50-week and 200-week moving averages. However, in the short term, the asset is undergoing a sharp correction to work off extreme overbought conditions following a steep advance. Momentum indicators like the MACD and RSI confirm this downward near-term pressure, suggesting a potential test of lower support zones around the 50-week SMA before the longer-term uptrend can resume.
Included In Lists
Related Tickers of Interest
EEM Weekly Chart
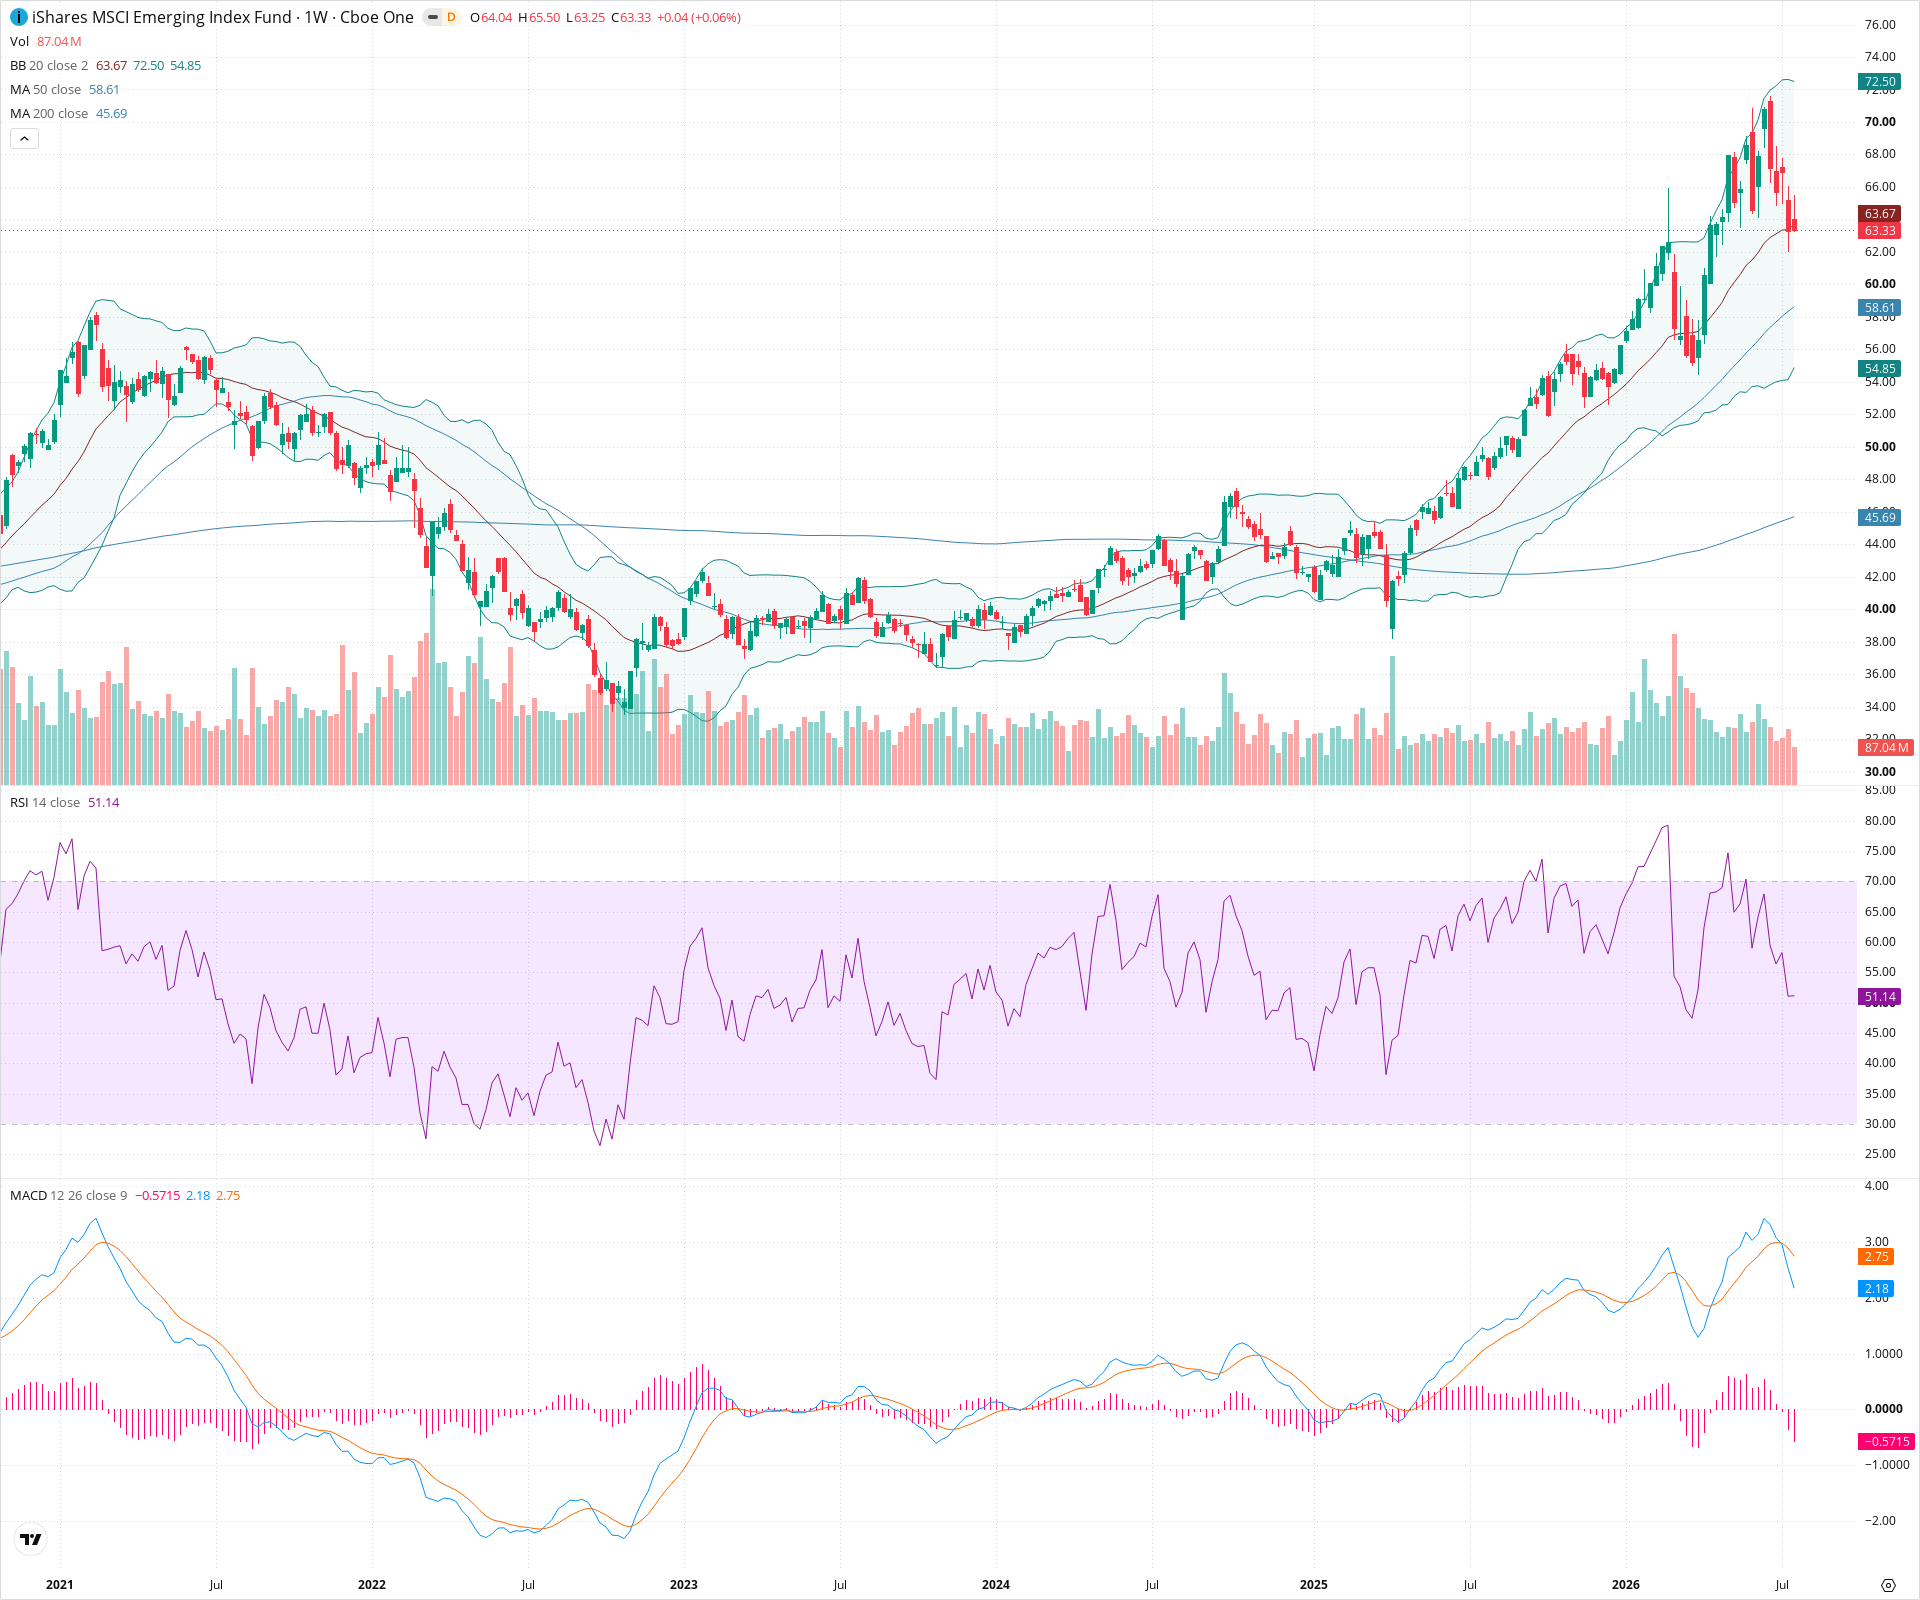
Sentiment
Short-term Sentiment (days to weeks): Bearish
Price has experienced a sharp multi-week pullback from recent highs, crossing below the 20-week SMA. This is accompanied by a bearish MACD crossover and sharply falling RSI.
Long-term Sentiment (weeks to months): Bullish
The long-term market structure remains an uptrend with higher highs and higher lows. The price is well above both the 50-week and 200-week SMAs, which are both sloping upward.
Report Metadata
- Timeframe: weekly
- Generated at: 2026-07-25T09:09:56.299Z
- Model: gemini-3.1-pro-preview
Support Price Levels
| Level | Range | Strength | Notes |
|---|---|---|---|
| $59.00 | $58.00 - $60.00 | Strong | Confluence zone of the rising 50-week SMA (currently 58.61) and a previous short consolidation area. |
| $53.00 | $52.00 - $54.00 | Strong | Major prior resistance zone that acted as a launchpad for the recent parabolic advance; likely to act as strong support. |
Resistance Price Levels
| Level | Range | Strength | Notes |
|---|---|---|---|
| $67.00 | $66.00 - $68.00 | Weak | Initial overhead resistance from the lower bounds of the recent sharp sell-off candles. |
| $73.25 | $72.00 - $74.50 | Strong | The recent major swing high and peak of the parabolic advance. |
Potential Chart Patterns in Formation
| Strength | Pattern | Signal | Target | Details |
|---|---|---|---|---|
| Strong | Mean Reversion | Bearish | N/A | After an explosive advance that pushed the price far above the upper Bollinger Band and RSI into deep overbought territory, the asset is experiencing a sharp mean reversion back toward its moving averages. |
| Strong | Bearish MACD Crossover | Bearish | N/A | The weekly MACD line has crossed below the signal line, and the histogram has turned negative, confirming a shift in short-term momentum to the downside. |
Frequently Asked Questions about EEM
What is the current sentiment for EEM?
The short-term sentiment for EEM is currently Bearish because Price has experienced a sharp multi-week pullback from recent highs, crossing below the 20-week SMA. This is accompanied by a bearish MACD crossover and sharply falling RSI.. The long-term trend is classified as Bullish.
What are the key support levels for EEM?
StockDips.AI has identified key support levels for EEM at $59.00 and $53.00. These levels may represent potential accumulation zones where buying interest could emerge.
Is EEM in a significant dip or a Value Dip right now?
EEM has a Value Score of 90/100. It is currently flagged as a significant dip in the Top Dips list. It is also listed as a Value Dip because long-term sentiment is bullish.
View the full interactive analysis on StockDips.AI.