ETH Weekly Technical Analysis
Ethereum
Blockchain platform that enables smart contracts and decentralized applications (dApps).
ETH Technical Analysis Summary
Ethereum currently displays a bearish technical posture on the weekly timeframe. The recent rejection at higher levels has led to a breakdown below near-term support and the 20-week SMA, accompanied by deteriorating momentum as confirmed by the MACD and RSI. Long-term investors should monitor the critical 1500-1650 support zone, as a failure to hold this level could expose the asset to much deeper macro tests, while significant overhead resistance limits near-term upside potential.
Included In Lists
Related Tickers of Interest
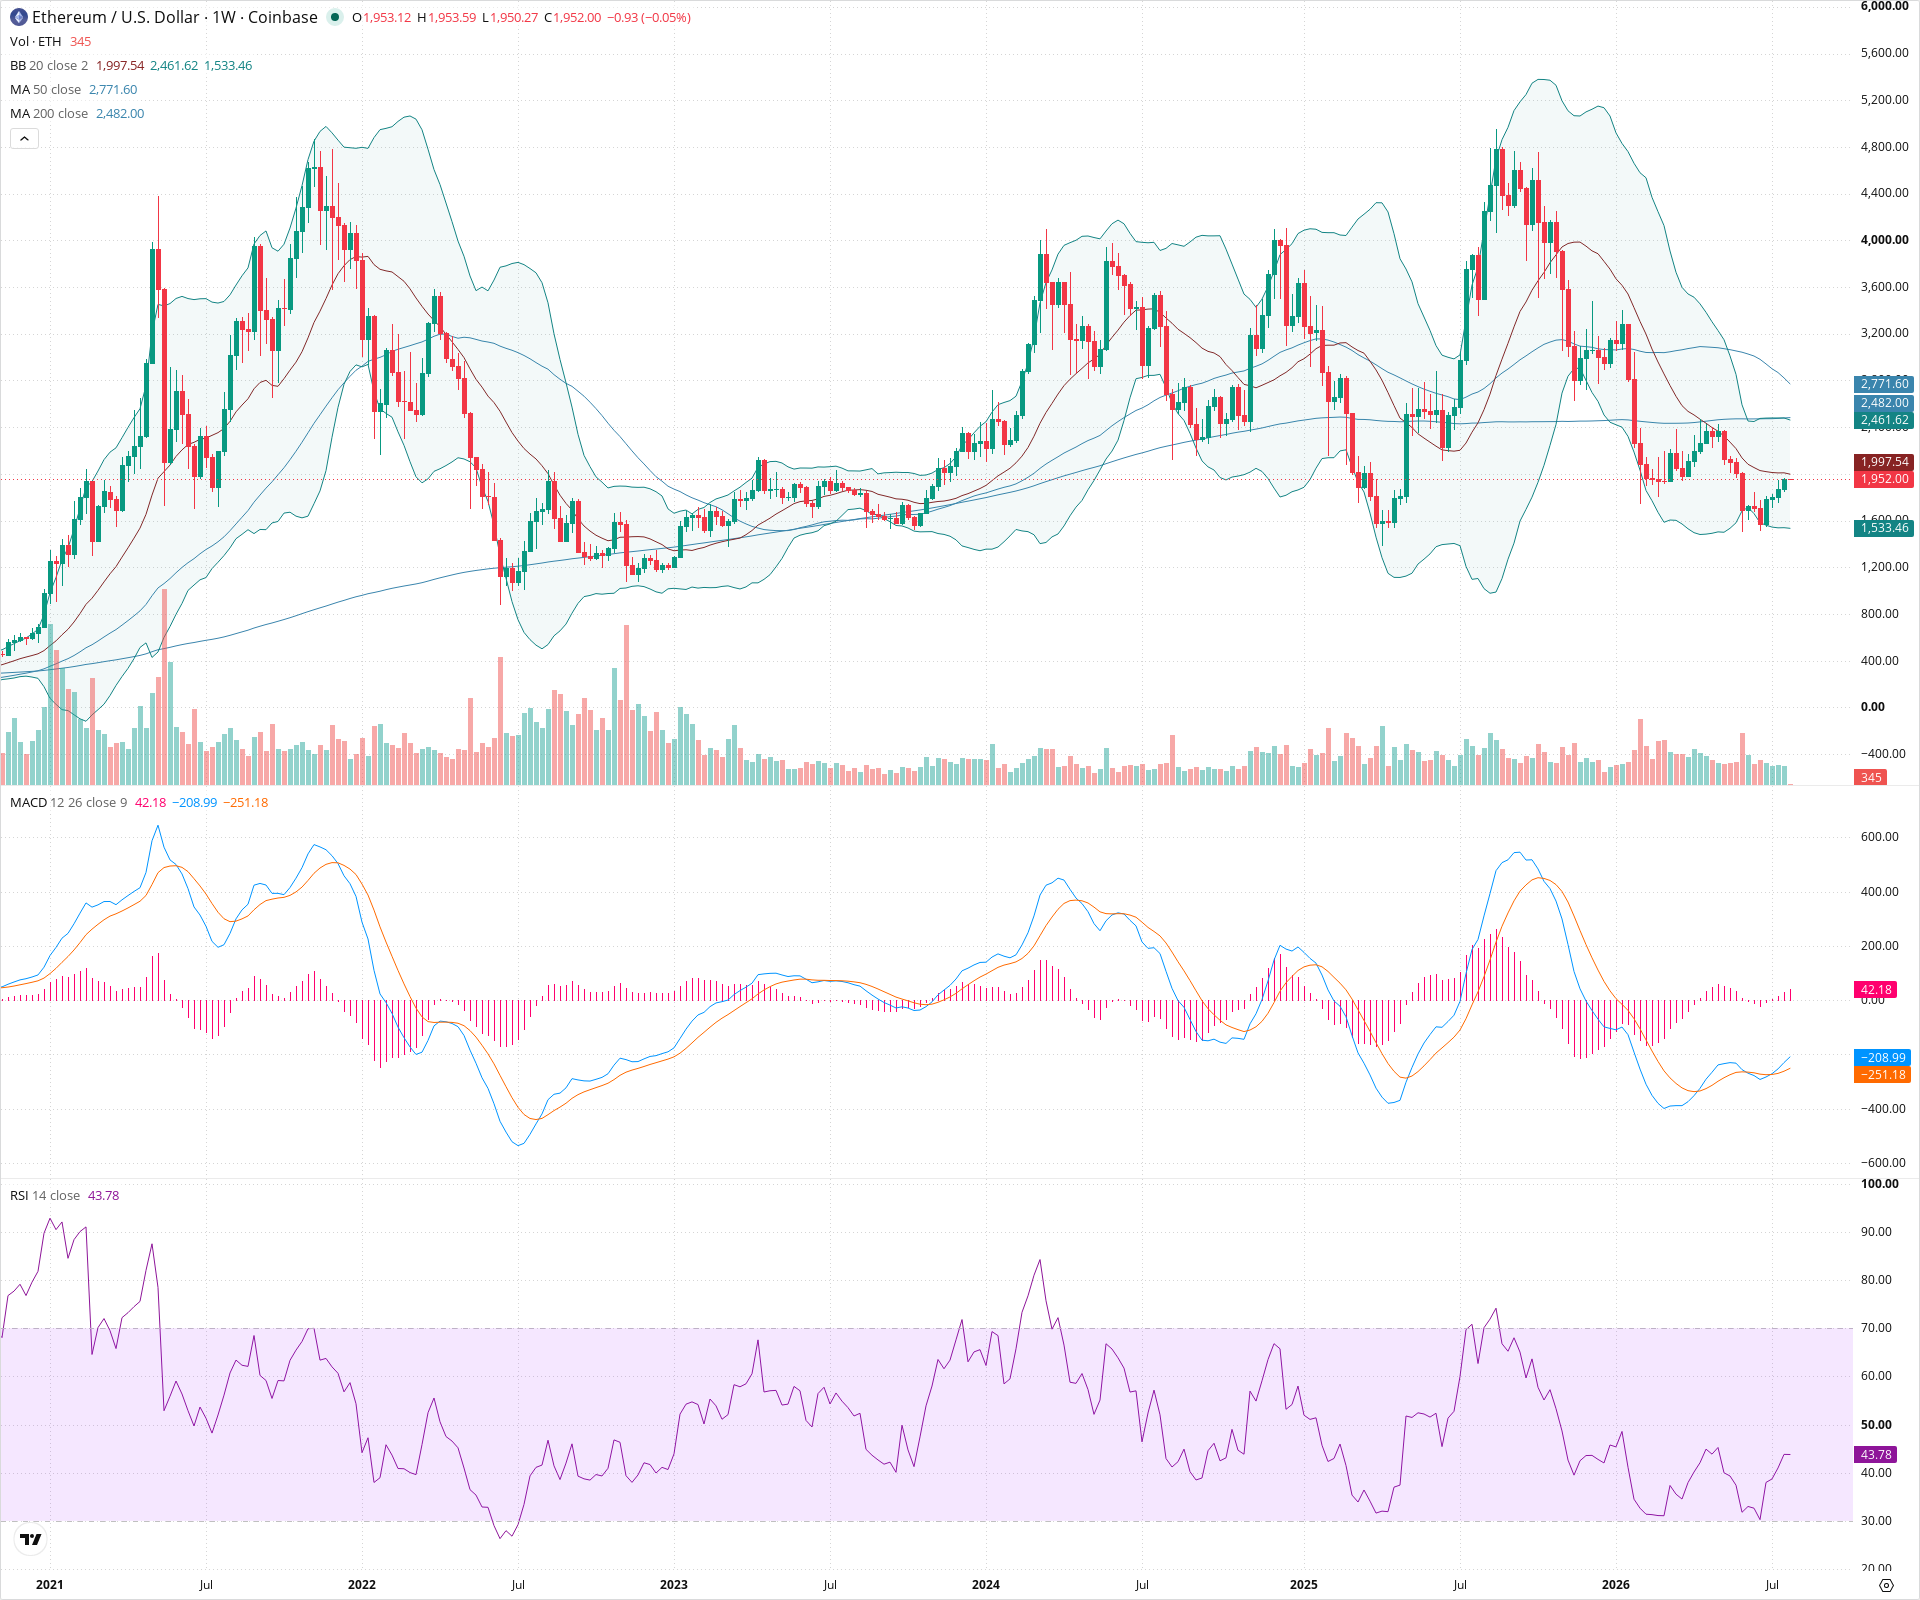
ETH Weekly Chart
Sentiment
Short-term Sentiment (days to weeks): Bearish
Price is trending downwards below the 20-week SMA with a series of red candles. The MACD histogram is negative and expanding downwards, while the RSI is declining below the 50 centerline, all indicating strong short-term bearish momentum.
Long-term Sentiment (weeks to months): Bearish
The macro chart structure exhibits a series of lower highs following the all-time high peak. Price is currently failing to hold above key long-term moving averages, suggesting the overarching primary trend remains tilted to the downside.
Report Metadata
- Timeframe: weekly
- Generated at: 2026-07-27T00:03:25.001Z
- Model: gemini-3.1-pro-preview
Support Price Levels
| Level | Range | Strength | Notes |
|---|---|---|---|
| $1,575.00 | $1,500.00 - $1,650.00 | Strong | A significant prior consolidation zone and structural swing low area, roughly aligning with the lower Bollinger Band projection. |
| $950.00 | $850.00 - $1,050.00 | Strong | The macro cycle bottom and a major historical demand zone. |
Resistance Price Levels
| Level | Range | Strength | Notes |
|---|---|---|---|
| $2,075.00 | $2,000.00 - $2,150.00 | Weak | Immediate overhead resistance zone encompassing the 20-week SMA (middle Bollinger Band) and recent local swing highs. |
| $2,500.00 | $2,400.00 - $2,600.00 | Strong | A dense resistance zone featuring prior structural support-turned-resistance and the confluence of long-term moving averages (50 and 200-week SMAs). |
Potential Chart Patterns in Formation
| Strength | Pattern | Signal | Target | Details |
|---|---|---|---|---|
| Strong | Bearish Channel Breakdown | Bearish | $1,550.00 | Following a prolonged recovery phase from the macro lows, price action formed an ascending structure that has recently broken to the downside, signaling a potential resumption of the broader downtrend. |
Frequently Asked Questions about ETH
What is the current sentiment for ETH?
The short-term sentiment for ETH is currently Bearish because Price is trending downwards below the 20-week SMA with a series of red candles. The MACD histogram is negative and expanding downwards, while the RSI is declining below the 50 centerline, all indicating strong short-term bearish momentum.. The long-term trend is classified as Bearish.
What are the key support levels for ETH?
StockDips.AI has identified key support levels for ETH at $1,575.00 and $950.00. These levels may represent potential accumulation zones where buying interest could emerge.
Is ETH in a significant dip or a Value Dip right now?
ETH has a Value Score of 40/100. It is not currently flagged as a significant dip in the Top Dips list. It is not listed as a Value Dip because the long-term sentiment or value-score threshold does not qualify.
View the full interactive analysis on StockDips.AI.