IWM Weekly Technical Analysis
US Small Cap Index (2000)
iShares Russell 2000 ETF - Tracks the index of 2000 small U.S. companies representing the small-cap segment.
IWM Technical Analysis Summary
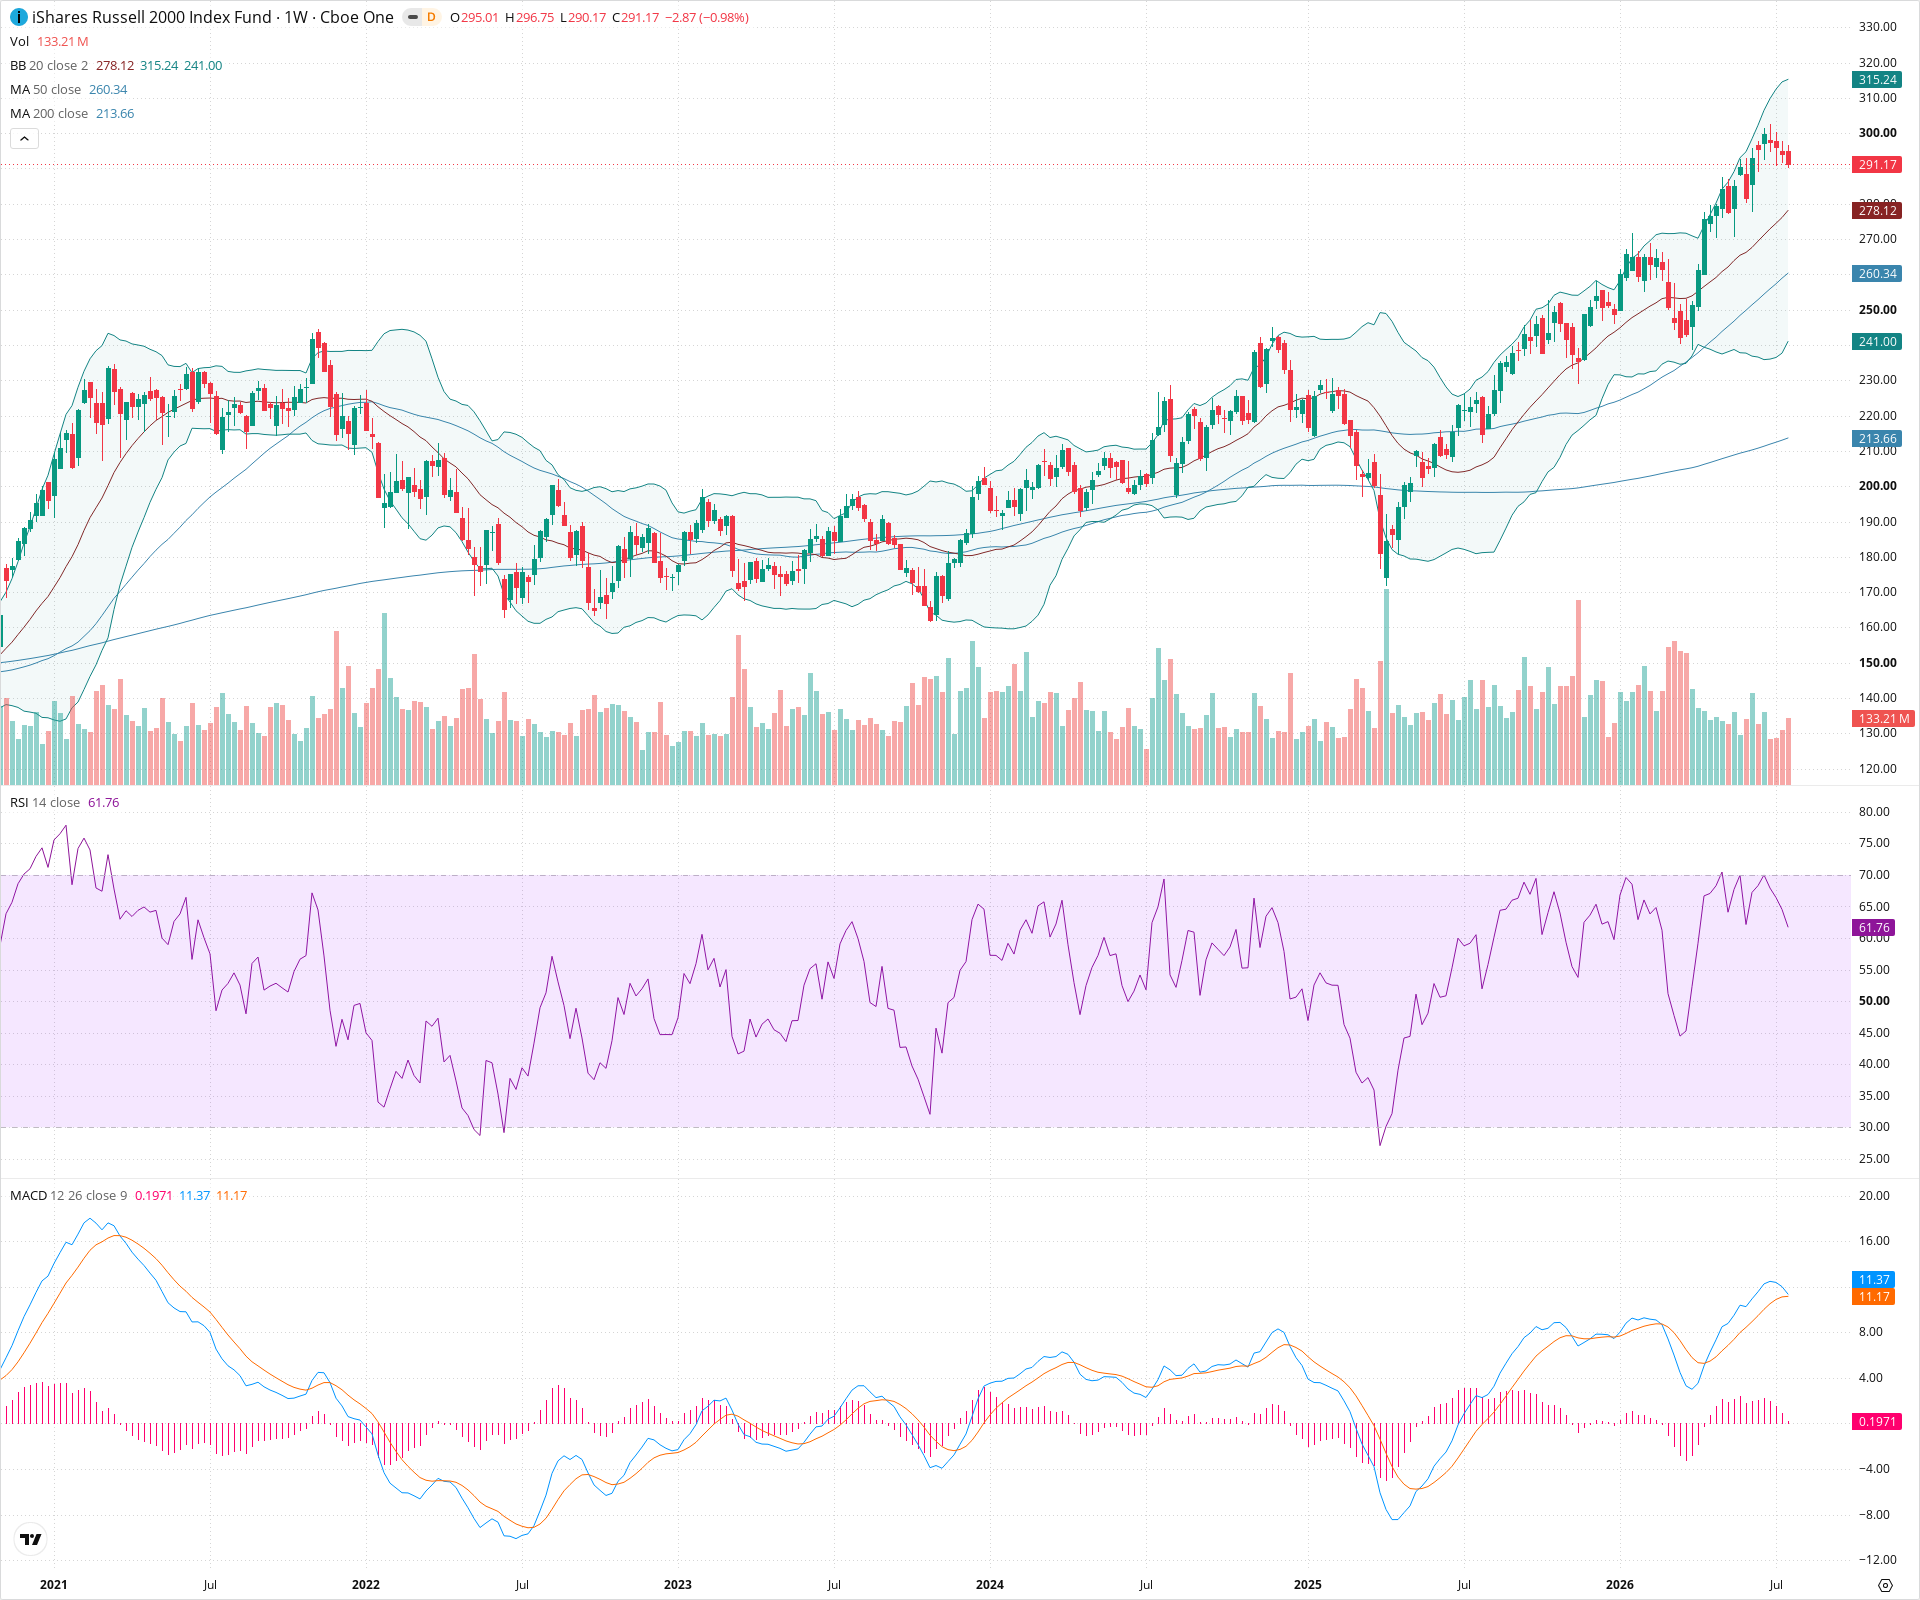
The weekly chart indicates a highly bullish long-term technical picture following a successful breakout from a multi-year consolidation base. The asset is currently in a strong, established uptrend characterized by rising moving averages and positive momentum indicators. While short-term price action shows minor consolidation after testing recent highs near 315, the overall path of least resistance remains upward as long as key support zones hold.
Included In Lists
Related Tickers of Interest
IWM Weekly Chart
Sentiment
Short-term Sentiment (days to weeks): Bullish
Price is maintaining a sequence of higher highs and higher lows while trending above the rising 20-week SMA. RSI remains comfortably in the bullish zone above 50, though recent slight narrowing of the MACD histogram suggests minor momentum deceleration.
Long-term Sentiment (weeks to months): Bullish
The chart displays a confirmed breakout from a massive multi-year base. The long-term trend is strongly upward, supported by a rising 50-week SMA which has crossed above the 200-week SMA, indicating a sustained bullish macro regime.
Report Metadata
- Timeframe: weekly
- Generated at: 2026-07-25T09:01:56.262Z
- Model: gemini-3.1-pro-preview
Support Price Levels
| Level | Range | Strength | Notes |
|---|---|---|---|
| $280.00 | $275.00 - $285.00 | Weak | Immediate dynamic support zone aligning with the rising 20-week SMA and recent minor consolidation areas. |
| $250.00 | $245.00 - $255.00 | Strong | Previous structural swing low area formed before the most recent strong leg higher, now acting as solid underlying support. |
| $215.00 | $210.00 - $220.00 | Strong | Major historical support zone that aligns closely with the current position of the long-term 200-week SMA. |
Resistance Price Levels
| Level | Range | Strength | Notes |
|---|---|---|---|
| $315.00 | $310.00 - $320.00 | Strong | The area encompassing the recent multi-year peak; price currently faces selling pressure upon approaching this zone. |
Potential Chart Patterns in Formation
| Strength | Pattern | Signal | Target | Details |
|---|---|---|---|---|
| Strong | Multi-Year Base Breakout | Bullish | N/A | Price spent several years consolidating in a large range roughly between 170 and 240 before staging a decisive breakout to the upside, initiating the current strong macro uptrend. |
Frequently Asked Questions about IWM
What is the current sentiment for IWM?
The short-term sentiment for IWM is currently Bullish because Price is maintaining a sequence of higher highs and higher lows while trending above the rising 20-week SMA. RSI remains comfortably in the bullish zone above 50, though recent slight narrowing of the MACD histogram suggests minor momentum deceleration.. The long-term trend is classified as Bullish.
What are the key support levels for IWM?
StockDips.AI has identified key support levels for IWM at $280.00 and $250.00. These levels may represent potential accumulation zones where buying interest could emerge.
Is IWM in a significant dip or a Value Dip right now?
IWM has a Value Score of 97/100. It is currently flagged as a significant dip in the Top Dips list. It is also listed as a Value Dip because long-term sentiment is bullish.
View the full interactive analysis on StockDips.AI.