QQQ Weekly Technical Analysis
Nasdaq-100 Index (Tech)
Invesco QQQ - Follows the Nasdaq-100 index, heavily weighted toward major technology companies.
QQQ Technical Analysis Summary
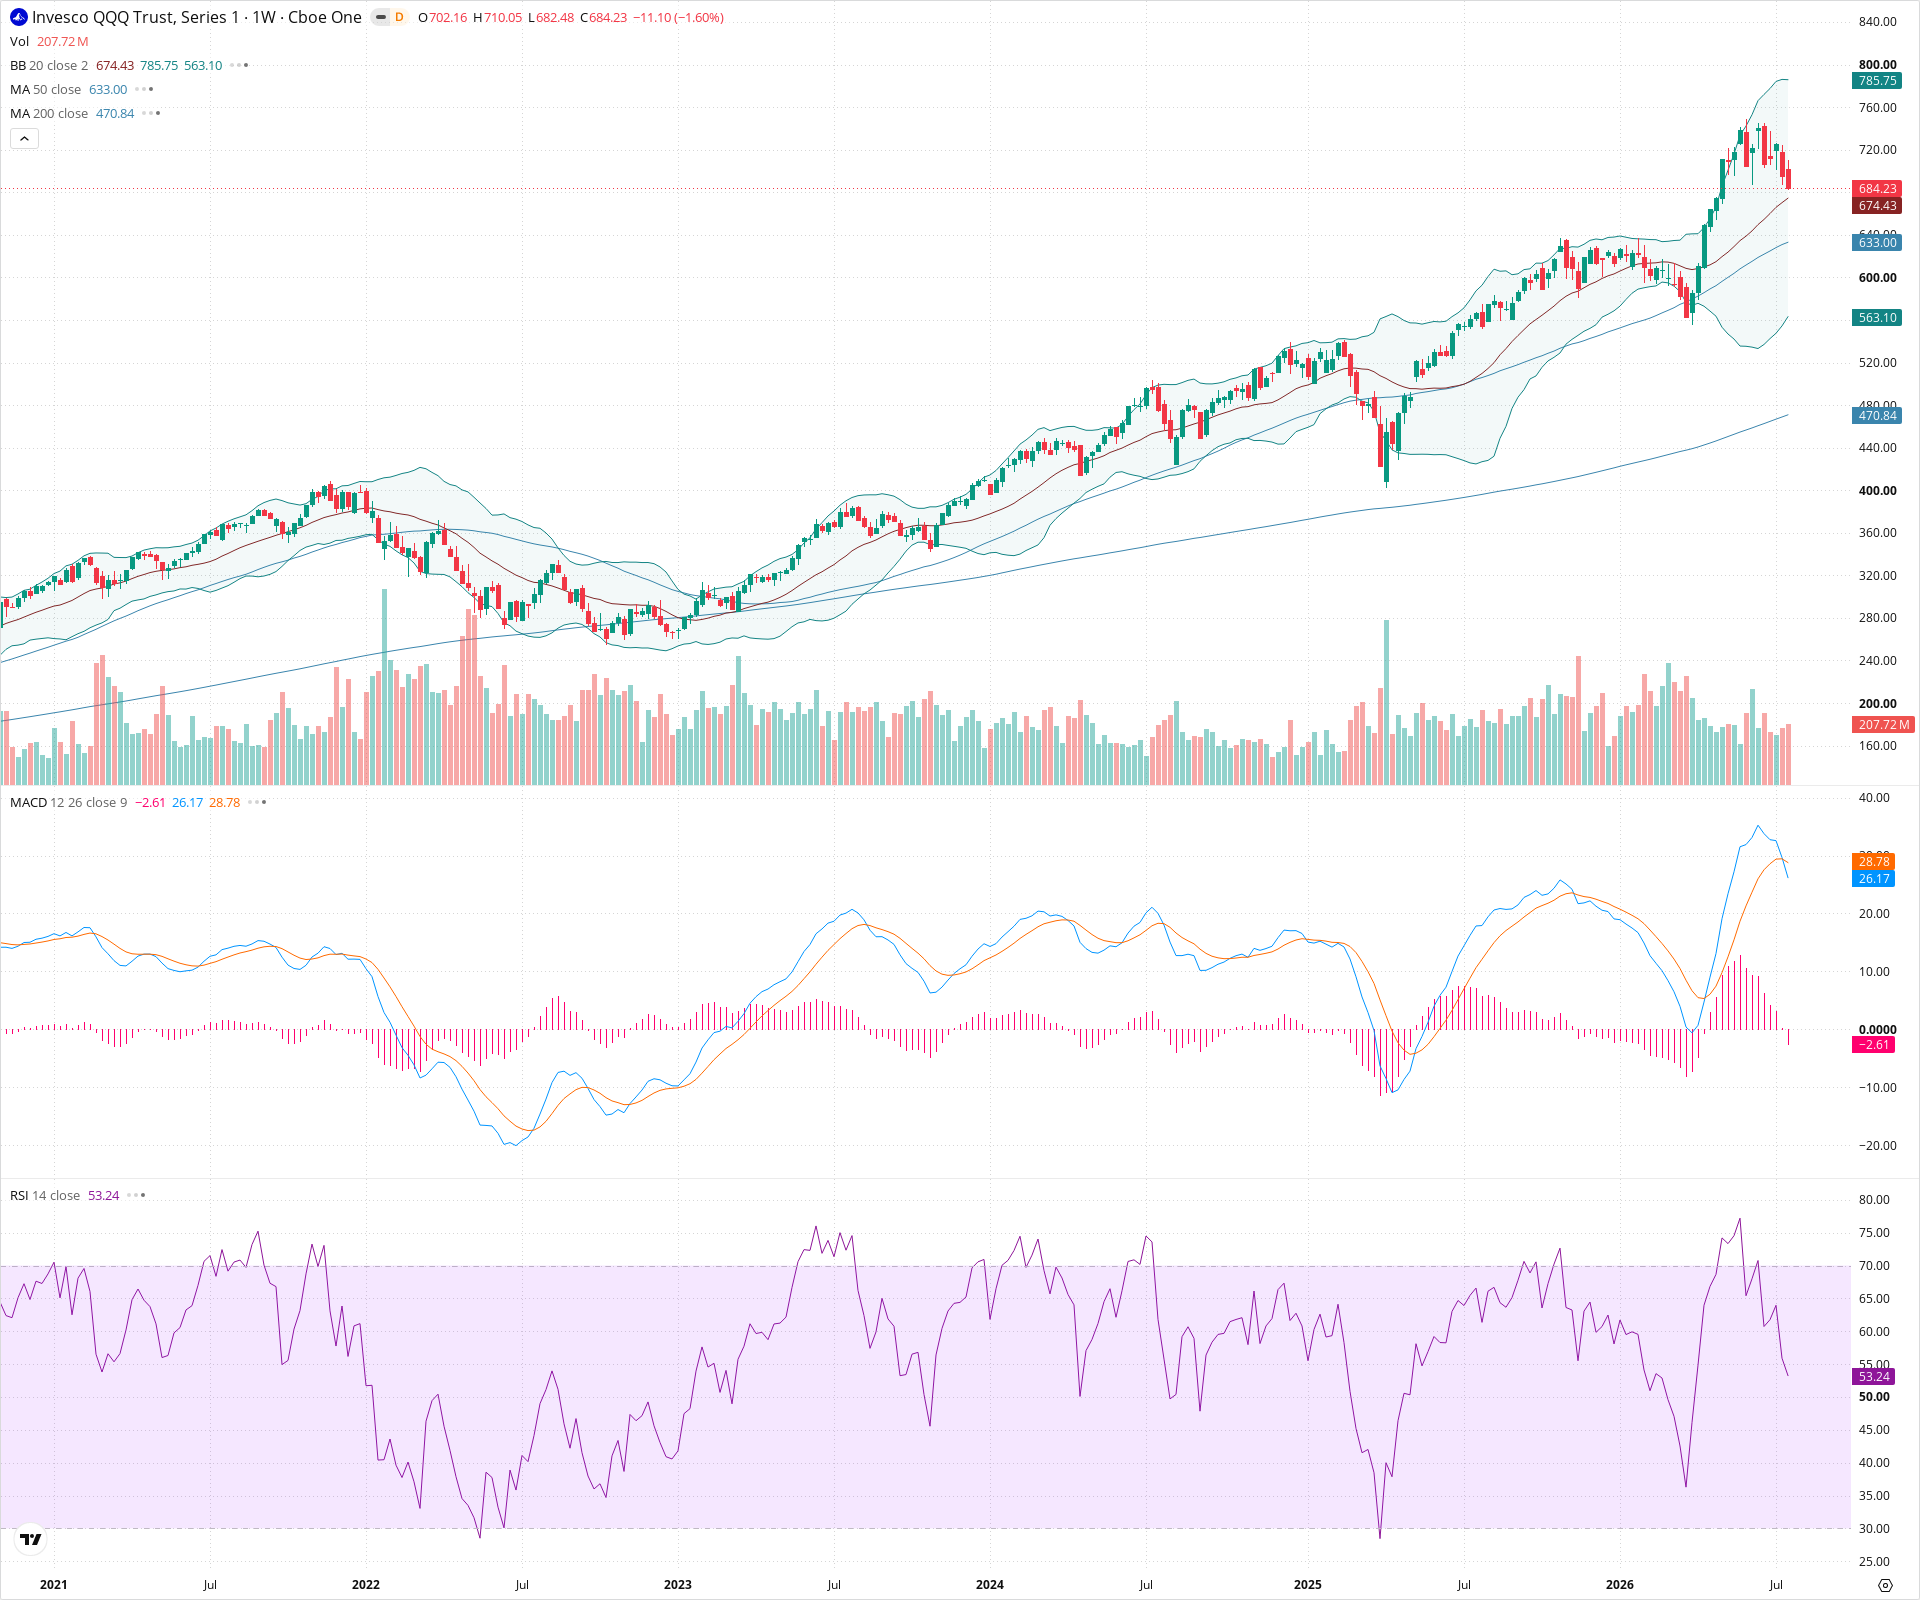
QQQ remains in a dominant long-term uptrend, clearly visible by its position above the rising 50-week and 200-week moving averages. In the near term, the asset is experiencing a sharp but standard corrective pullback after reaching extended levels. The weekly MACD bearish crossover suggests this consolidation phase may take some time, with the 50-week SMA acting as the next critical line of defense if current levels fail to hold.
Included In Lists
Related Tickers of Interest
QQQ Weekly Chart
Sentiment
Short-term Sentiment (days to weeks): Neutral
The price is undergoing a significant pullback from recent highs, confirmed by a bearish crossover on the weekly MACD and declining RSI. However, it is currently testing initial dynamic support at the 20-week SMA, suggesting a period of consolidation rather than an immediate trend reversal.
Long-term Sentiment (weeks to months): Bullish
The broader multi-year trend remains firmly intact. The price continues to trade in a sequence of higher highs and higher lows, well above the rising 50-week and 200-week Simple Moving Averages.
Report Metadata
- Timeframe: weekly
- Generated at: 2026-07-25T09:01:19.899Z
- Model: gemini-3.1-pro-preview
Support Price Levels
| Level | Range | Strength | Notes |
|---|---|---|---|
| $672.50 | $660.00 - $685.00 | Weak | Immediate support zone encompassing the 20-week SMA (middle Bollinger Band) which price is currently testing. |
| $625.00 | $610.00 - $640.00 | Strong | Major structural support zone aligning with the rising 50-week SMA and previous periods of price congestion. |
| $565.00 | $550.00 - $580.00 | Strong | Previous major swing low area acting as deeper structural support in a broader market correction. |
Resistance Price Levels
| Level | Range | Strength | Notes |
|---|---|---|---|
| $780.00 | $760.00 - $800.00 | Strong | The recent all-time high territory and the upper boundary of the Bollinger Bands where strong selling pressure was encountered. |
Potential Chart Patterns in Formation
| Strength | Pattern | Signal | Target | Details |
|---|---|---|---|---|
| Strong | Mean Reversion Pullback | Bearish | N/A | Following a steep advance that pushed RSI into overbought territory, the asset is experiencing a mean-reversion pullback. The weekly MACD has executed a bearish crossover, confirming the near-term loss of upward momentum. |
| Strong | Long-term Uptrend Structure | Bullish | N/A | A multi-year structural uptrend defined by consistent higher highs and higher lows, supported by upward-sloping primary 50 and 200 moving averages. |
Frequently Asked Questions about QQQ
What is the current sentiment for QQQ?
The short-term sentiment for QQQ is currently Neutral because The price is undergoing a significant pullback from recent highs, confirmed by a bearish crossover on the weekly MACD and declining RSI. However, it is currently testing initial dynamic support at the 20-week SMA, suggesting a period of consolidation rather than an immediate trend reversal.. The long-term trend is classified as Bullish.
What are the key support levels for QQQ?
StockDips.AI has identified key support levels for QQQ at $672.50 and $625.00. These levels may represent potential accumulation zones where buying interest could emerge.
Is QQQ in a significant dip or a Value Dip right now?
QQQ has a Value Score of 82/100. It is currently flagged as a significant dip in the Top Dips list. It is also listed as a Value Dip because long-term sentiment is bullish.
View the full interactive analysis on StockDips.AI.