SOL Weekly Technical Analysis
Solana
High-performance blockchain supporting fast and inexpensive decentralized apps and NFTs.
SOL Technical Analysis Summary
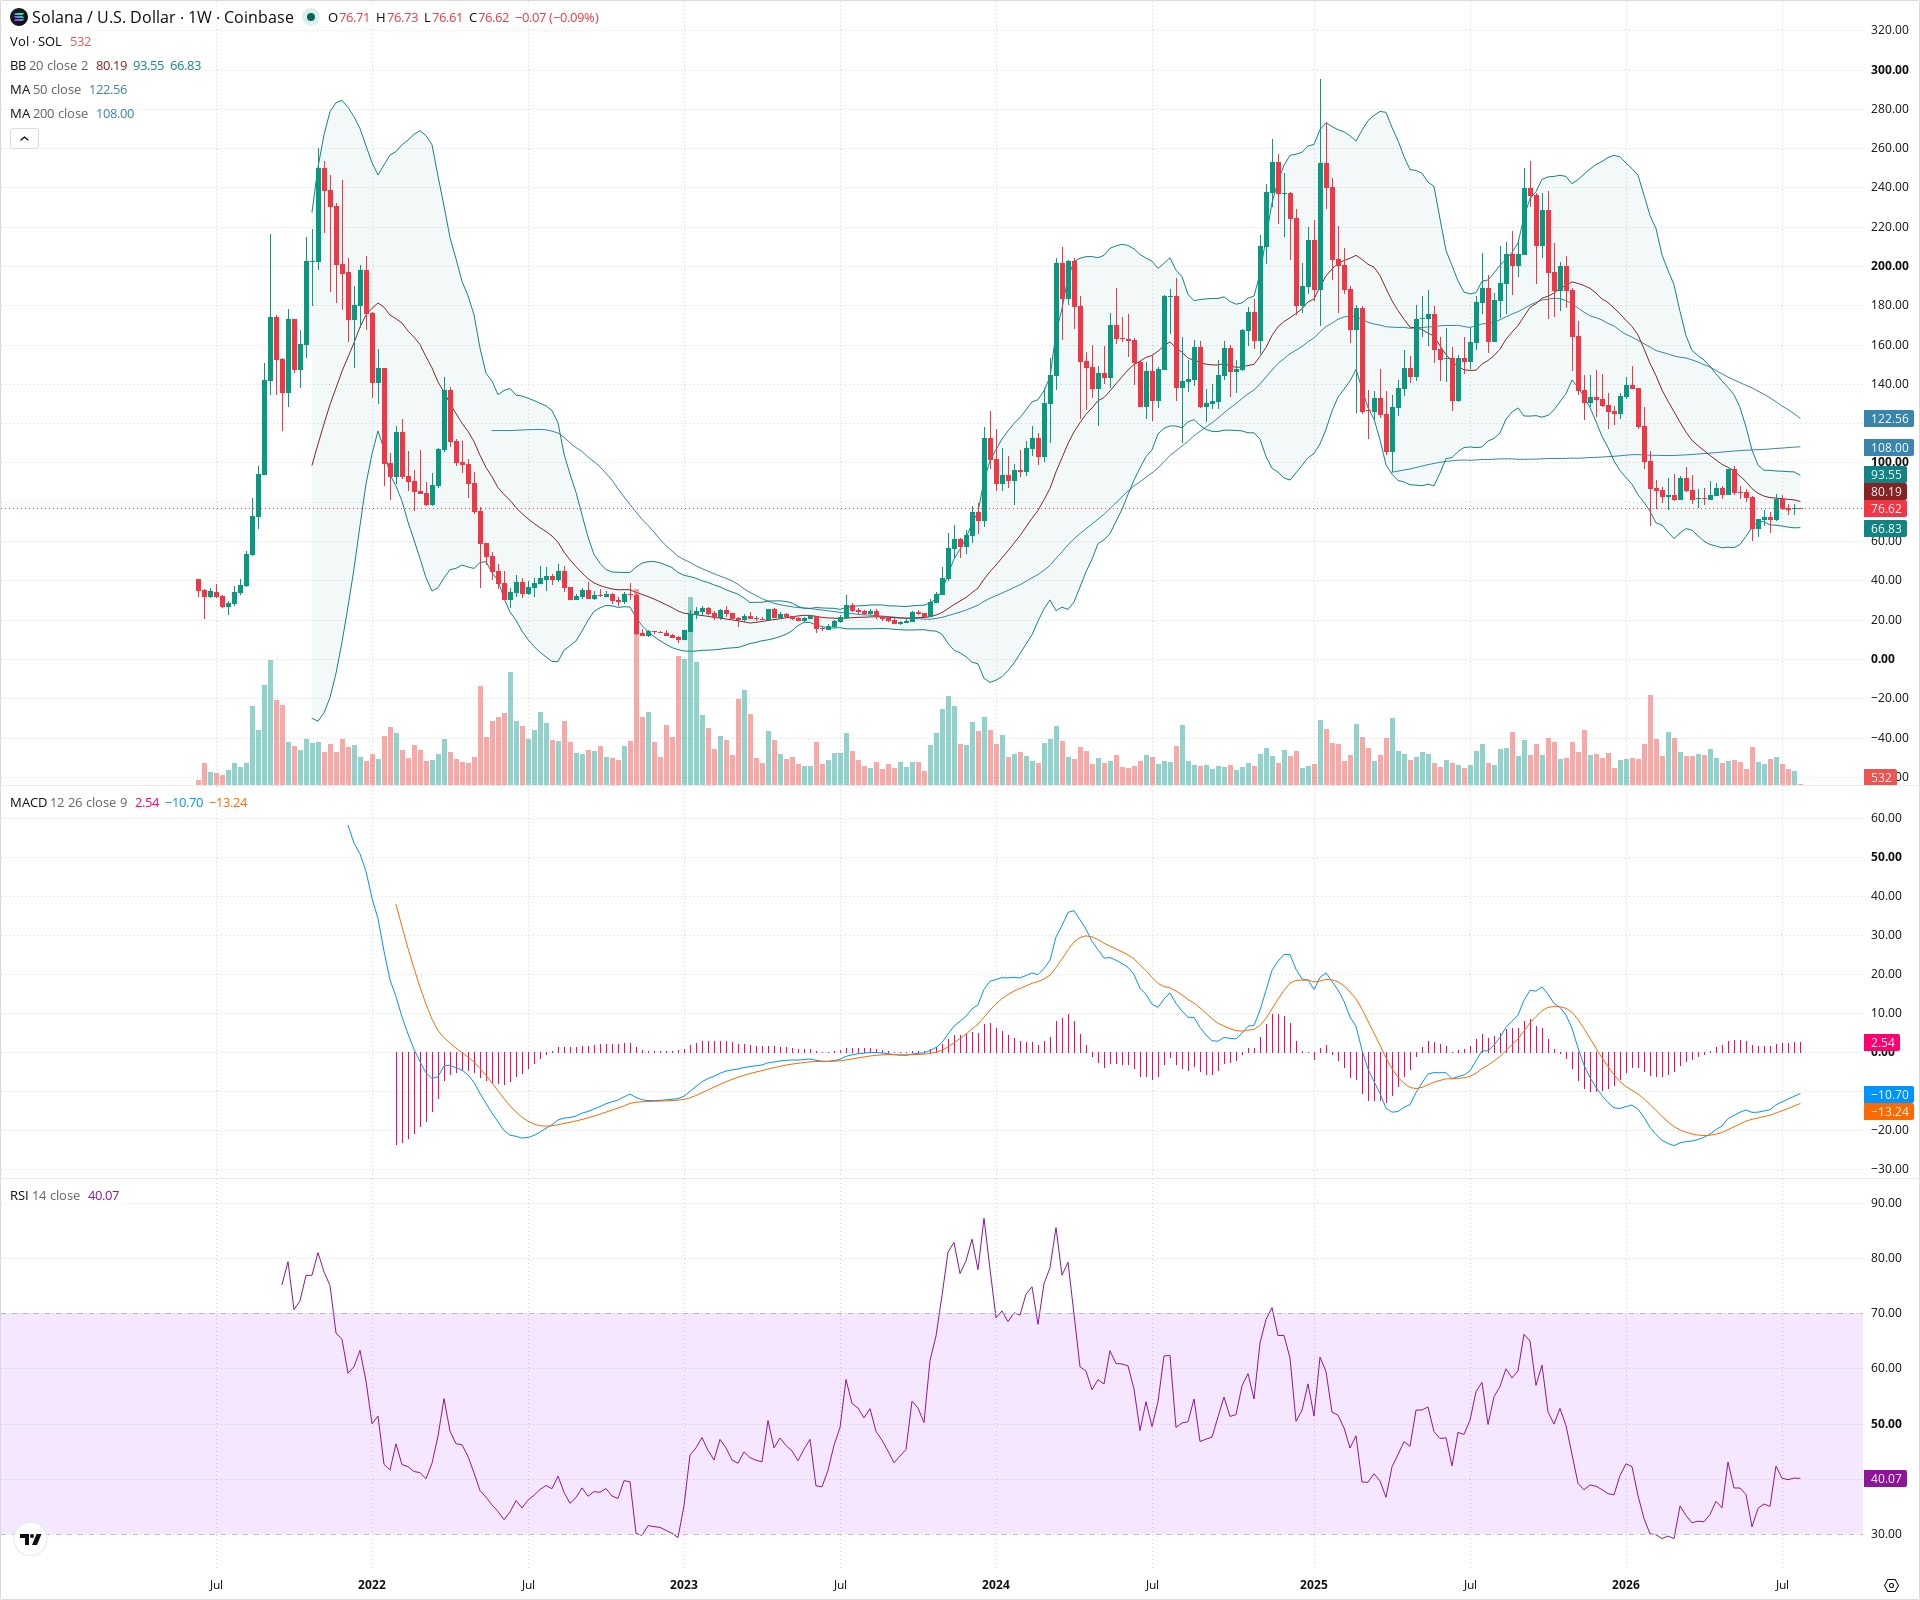
SOL is currently entrenched in a severe multi-month downtrend on the weekly timeframe, having suffered a massive rejection from the $220 region. The price has fallen below all key moving averages (20, 50, and 200-week SMAs) and is now attempting to base in the $60-$80 zone. While short-term oscillators like MACD hint at waning bearish momentum, the long-term technical structure remains decidedly bearish until buyers can reclaim the heavy resistance block above $100.
Included In Lists
Related Tickers of Interest
SOL Weekly Chart
Sentiment
Short-term Sentiment (days to weeks): Neutral
Price is consolidating after a steep decline, holding above recent swing lows. A bullish MACD crossover deep in negative territory and RSI ticking up from oversold levels suggests downward momentum is pausing.
Long-term Sentiment (weeks to months): Bearish
The macro structure is defined by lower highs and lower lows from the all-time high. Price has broken below major support levels and is currently trading below both the 50-week and 200-week SMAs.
Report Metadata
- Timeframe: weekly
- Generated at: 2026-07-27T00:02:36.202Z
- Model: gemini-3.1-pro-preview
Support Price Levels
| Level | Range | Strength | Notes |
|---|---|---|---|
| $65.00 | $60.00 - $70.00 | Strong | Recent weekly swing lows and confluence with the lower Bollinger Band. |
| $27.50 | $20.00 - $35.00 | Strong | Major historical macro bottom established in previous cycles. |
Resistance Price Levels
| Level | Range | Strength | Notes |
|---|---|---|---|
| $101.50 | $93.00 - $110.00 | Strong | Zone containing the 20-week SMA, 200-week SMA, and the psychological $100 level. |
| $130.00 | $120.00 - $140.00 | Strong | Previous structural support turned resistance, aligning with the declining 50-week SMA. |
| $210.00 | $200.00 - $220.00 | Strong | Major recent swing high where the previous multi-month rally failed. |
Potential Chart Patterns in Formation
| Strength | Pattern | Signal | Target | Details |
|---|---|---|---|---|
| Weak | Consolidation Range / Potential Bear Flag | Bearish | N/A | Following a steep drop from the $200+ level, price is moving sideways in a tight range near the lows. If support breaks, it may act as a bearish continuation pattern. |
Frequently Asked Questions about SOL
What is the current sentiment for SOL?
The short-term sentiment for SOL is currently Neutral because Price is consolidating after a steep decline, holding above recent swing lows. A bullish MACD crossover deep in negative territory and RSI ticking up from oversold levels suggests downward momentum is pausing.. The long-term trend is classified as Bearish.
What are the key support levels for SOL?
StockDips.AI has identified key support levels for SOL at $65.00 and $27.50. These levels may represent potential accumulation zones where buying interest could emerge.
Is SOL in a significant dip or a Value Dip right now?
SOL has a Value Score of 76/100. It is currently flagged as a significant dip in the Top Dips list. It is not listed as a Value Dip because the long-term sentiment or value-score threshold does not qualify.
View the full interactive analysis on StockDips.AI.