SPY Weekly Technical Analysis
S&P 500 Index
SPDR S&P 500 ETF - Tracks the S&P 500 index of the largest U.S. companies and serves as a core benchmark for the U.S. market.
SPY Technical Analysis Summary
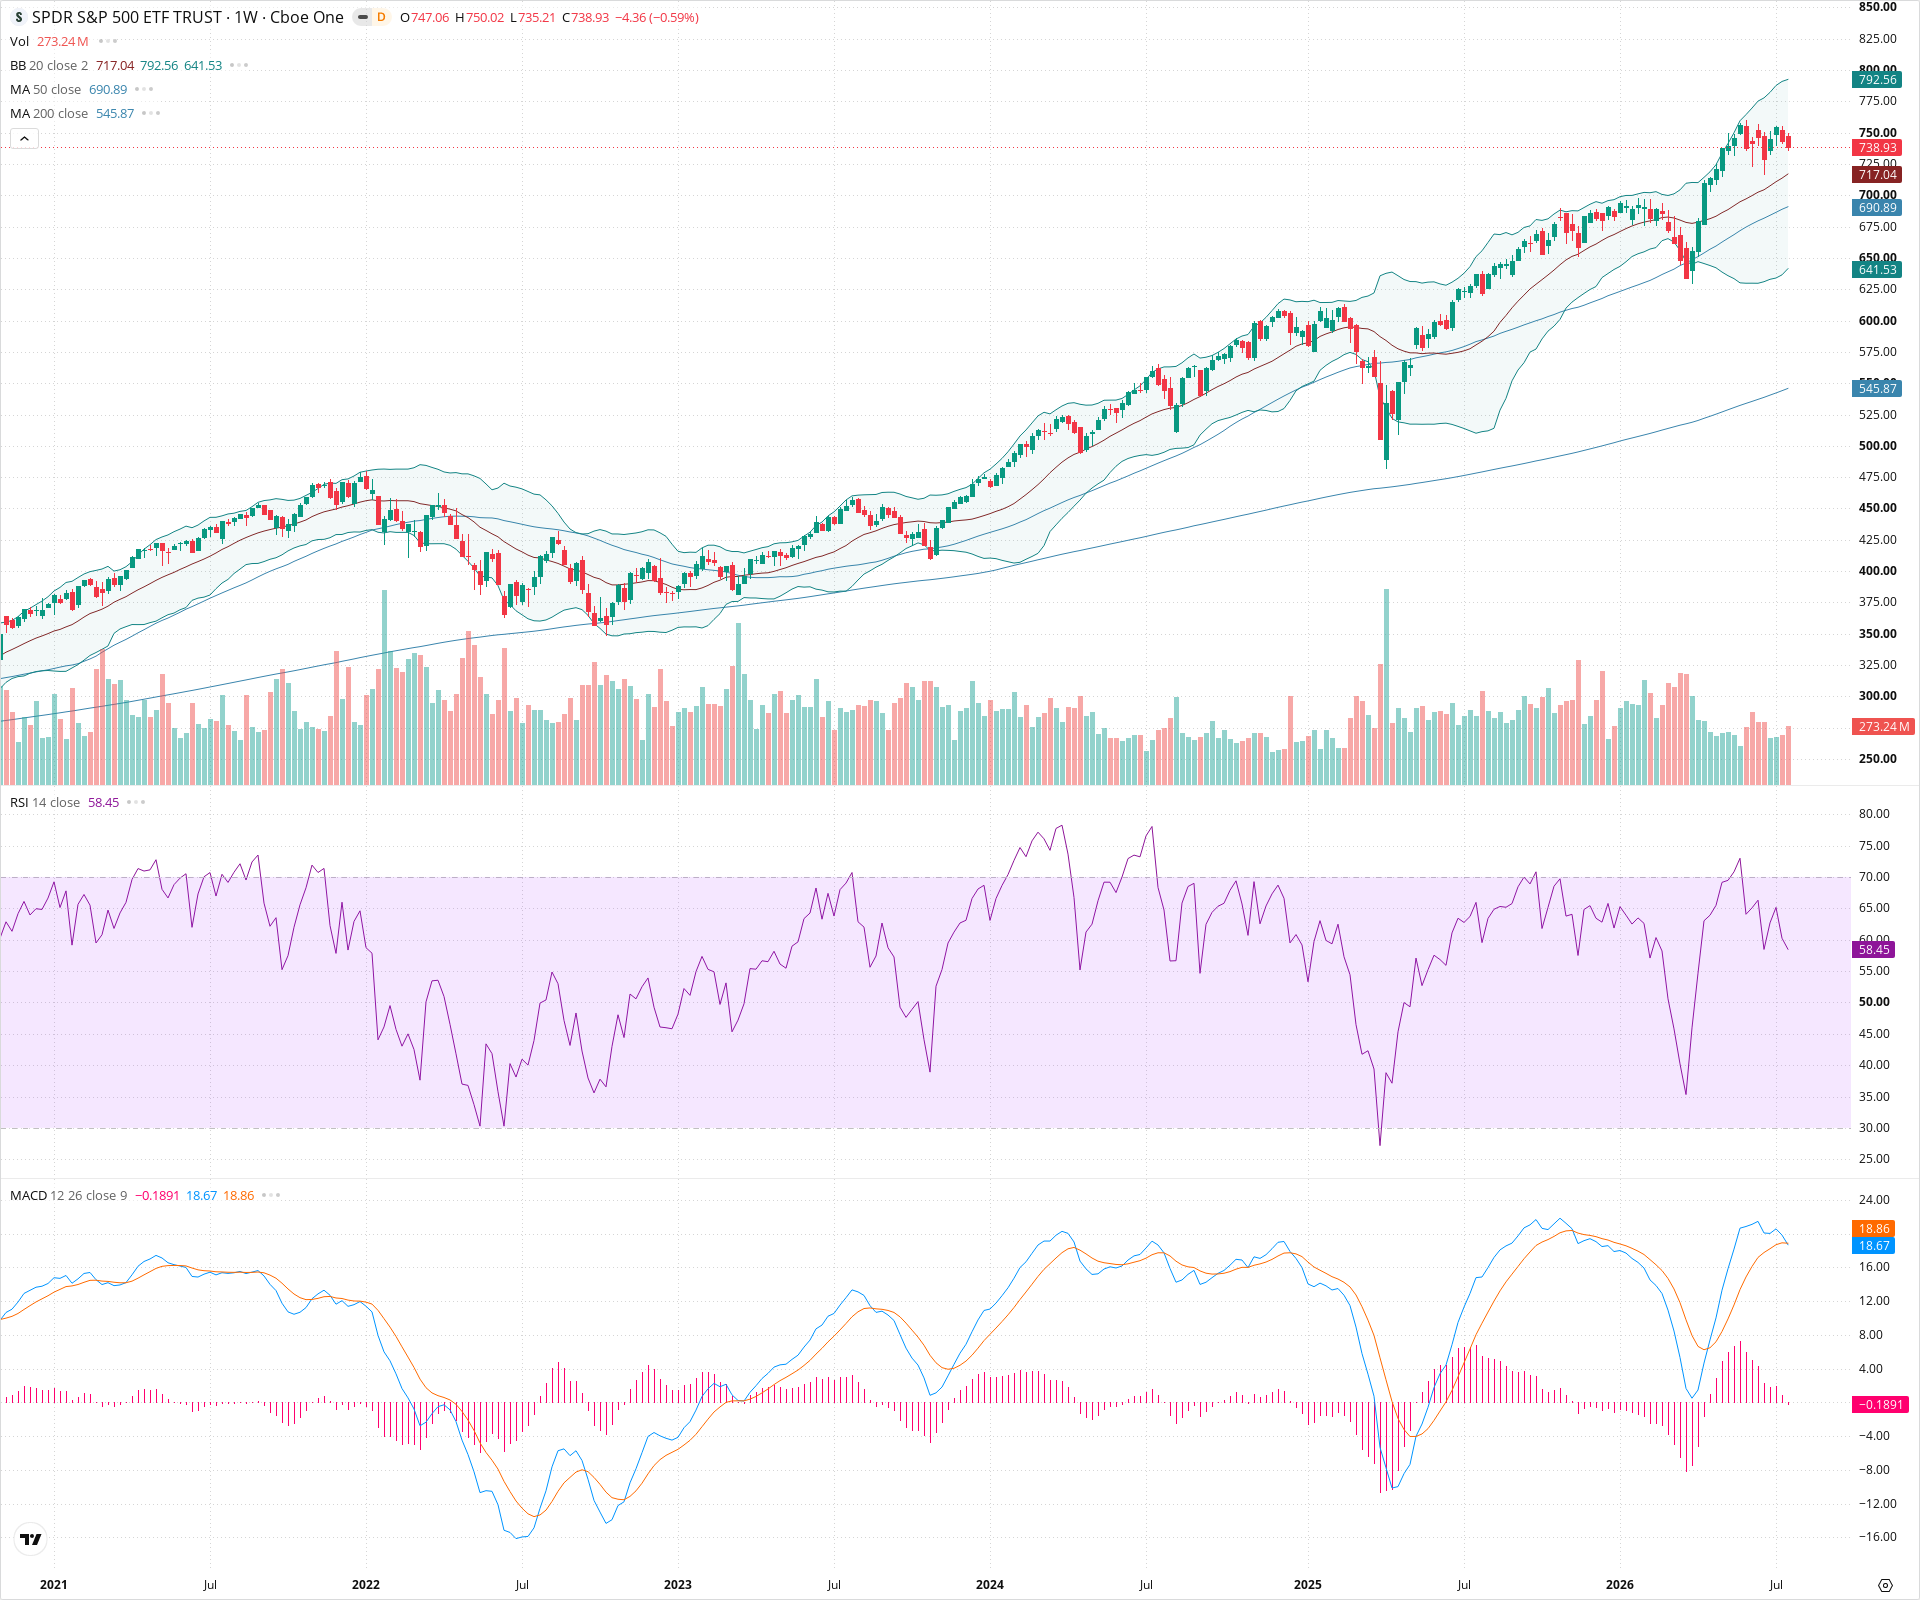
The SPY weekly chart displays a robust, multi-year primary uptrend, strongly supported by rising 50-week and 200-week moving averages. While long-term momentum remains firmly bullish, the market is currently undergoing a normal short-term consolidation phase, as evidenced by a cooling RSI and a weekly MACD crossover. For long-term investors, the structural integrity of the bull market remains intact as long as major moving average supports hold.
Included In Lists
Related Tickers of Interest
SPY Weekly Chart
Sentiment
Short-term Sentiment (days to weeks): Neutral
Price is consolidating after a strong impulse move, with the weekly MACD showing a bearish crossover and negative histogram momentum, while RSI cools off from overbought levels toward the midline.
Long-term Sentiment (weeks to months): Bullish
The chart exhibits a powerful structural uptrend characterized by higher highs and higher lows, with price remaining significantly above the rising 50-week and 200-week Simple Moving Averages.
Report Metadata
- Timeframe: weekly
- Generated at: 2026-07-25T09:01:03.398Z
- Model: gemini-3.1-pro-preview
Support Price Levels
| Level | Range | Strength | Notes |
|---|---|---|---|
| $717.50 | $710.00 - $725.00 | Strong | Dynamic support zone converging with the rising 20-week SMA (middle Bollinger Band) and recent swing low consolidation. |
| $685.00 | $675.00 - $695.00 | Strong | Major structural support zone aligning with previous resistance-turned-support and the ascending 50-week SMA. |
| $647.50 | $640.00 - $655.00 | Weak | Deeper structural support at prior significant consolidation highs. |
Resistance Price Levels
| Level | Range | Strength | Notes |
|---|---|---|---|
| $792.50 | $785.00 - $800.00 | Strong | Recent all-time high zone and psychological round number resistance. |
| $825.00 | $820.00 - $830.00 | Weak | Next major psychological level based on grid extensions. |
Potential Chart Patterns in Formation
| Strength | Pattern | Signal | Target | Details |
|---|---|---|---|---|
| Strong | Ascending Channel | Bullish | N/A | A long-term, multi-year ascending structure defining the primary bullish trend since the 2022 lows. |
| Weak | Bullish Consolidation | Bullish | N/A | Short-term sideways-to-downward price action digesting the recent steep advance, forming near historical highs. |
Frequently Asked Questions about SPY
What is the current sentiment for SPY?
The short-term sentiment for SPY is currently Neutral because Price is consolidating after a strong impulse move, with the weekly MACD showing a bearish crossover and negative histogram momentum, while RSI cools off from overbought levels toward the midline.. The long-term trend is classified as Bullish.
What are the key support levels for SPY?
StockDips.AI has identified key support levels for SPY at $717.50 and $685.00. These levels may represent potential accumulation zones where buying interest could emerge.
Is SPY in a significant dip or a Value Dip right now?
SPY has a Value Score of 34/100. It is not currently flagged as a significant dip in the Top Dips list. It is not listed as a Value Dip because the long-term sentiment or value-score threshold does not qualify.
View the full interactive analysis on StockDips.AI.