TRX Weekly Technical Analysis
Tron
TRON (TRX) is a decentralized blockchain platform for content sharing and dApps, aiming to create a free digital entertainment ecosystem; TRX is its native utility token used for transactions, governance (staking/voting), and powering the network, known for high throughput and low fees.
TRX Technical Analysis Summary
TRX remains in a strong, established long-term weekly uptrend. It is currently digesting recent gains, consolidating above the 50-week SMA. The long-term technical structure supports further upside once this consolidation phase resolves, provided it maintains support above the 0.28-0.31 zone.
Included In Lists
Related Tickers of Interest
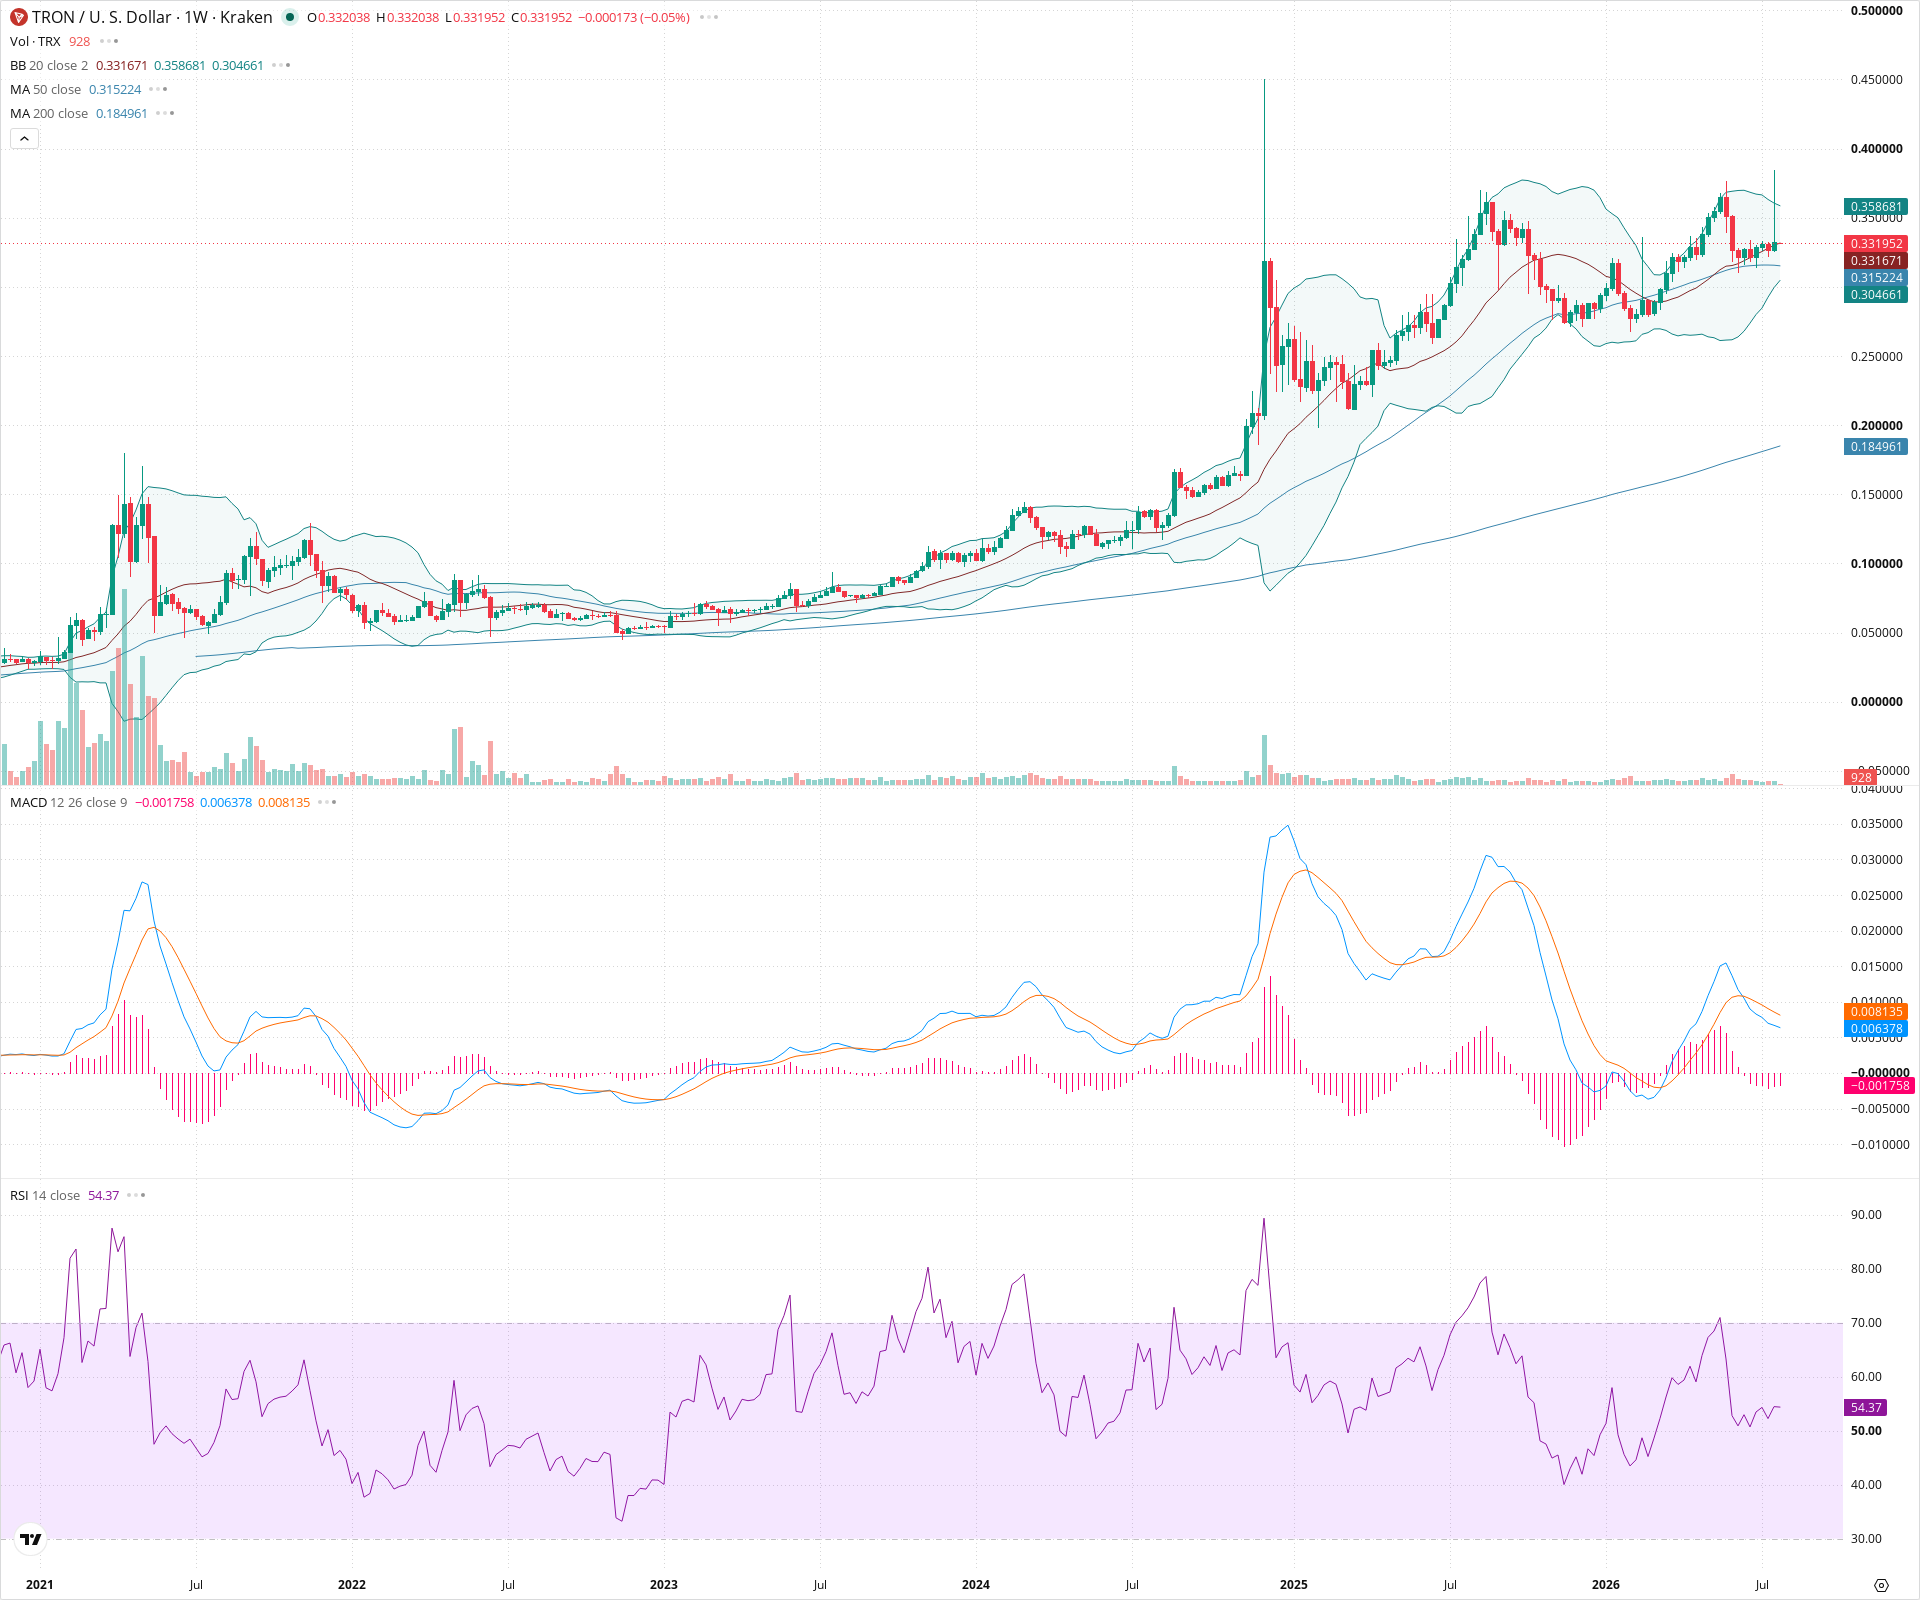
TRX Weekly Chart
Sentiment
Short-term Sentiment (days to weeks): Bullish
Price is consolidating above the 20-week and 50-week SMAs after a strong uptrend. MACD histogram is negative but RSI remains above 50, suggesting a healthy pause in the prevailing trend.
Long-term Sentiment (weeks to months): Bullish
The chart displays a robust multi-year uptrend with the 50-week SMA sloping upward and consistently acting as dynamic support. Price is making higher highs and higher lows.
Report Metadata
- Timeframe: weekly
- Generated at: 2026-07-27T00:02:10.721Z
- Model: gemini-3.1-pro-preview
Support Price Levels
| Level | Range | Strength | Notes |
|---|---|---|---|
| $0.30 | $0.28 - $0.31 | Strong | Recent consolidation zone and confluence with the rising 50-week SMA. |
| $0.24 | $0.22 - $0.25 | Strong | Previous major structural resistance turned support. |
| $0.18 | $0.17 - $0.19 | Weak | Confluence with the 200-week SMA. |
Resistance Price Levels
| Level | Range | Strength | Notes |
|---|---|---|---|
| $0.39 | $0.37 - $0.40 | Strong | Recent multi-year high, acting as the primary overhead resistance. |
| $0.45 | $0.44 - $0.46 | Weak | Psychological zone above current all-time highs on this chart. |
Potential Chart Patterns in Formation
| Strength | Pattern | Signal | Target | Details |
|---|---|---|---|---|
| Strong | Bullish Flag/Pennant Consolidation | Bullish | N/A | Price is consolidating sideways to slightly down after a major impulsive move upward, forming a potential continuation pattern. |
Frequently Asked Questions about TRX
What is the current sentiment for TRX?
The short-term sentiment for TRX is currently Bullish because Price is consolidating above the 20-week and 50-week SMAs after a strong uptrend. MACD histogram is negative but RSI remains above 50, suggesting a healthy pause in the prevailing trend.. The long-term trend is classified as Bullish.
What are the key support levels for TRX?
StockDips.AI has identified key support levels for TRX at $0.30 and $0.24. These levels may represent potential accumulation zones where buying interest could emerge.
Is TRX in a significant dip or a Value Dip right now?
TRX has a Value Score of 107/100. It is not currently flagged as a significant dip in the Top Dips list. It is not listed as a Value Dip because the long-term sentiment or value-score threshold does not qualify.
View the full interactive analysis on StockDips.AI.