XRP Weekly Technical Analysis
XRP
Designed for fast and low-cost cross-border payments and remittances.
XRP Technical Analysis Summary
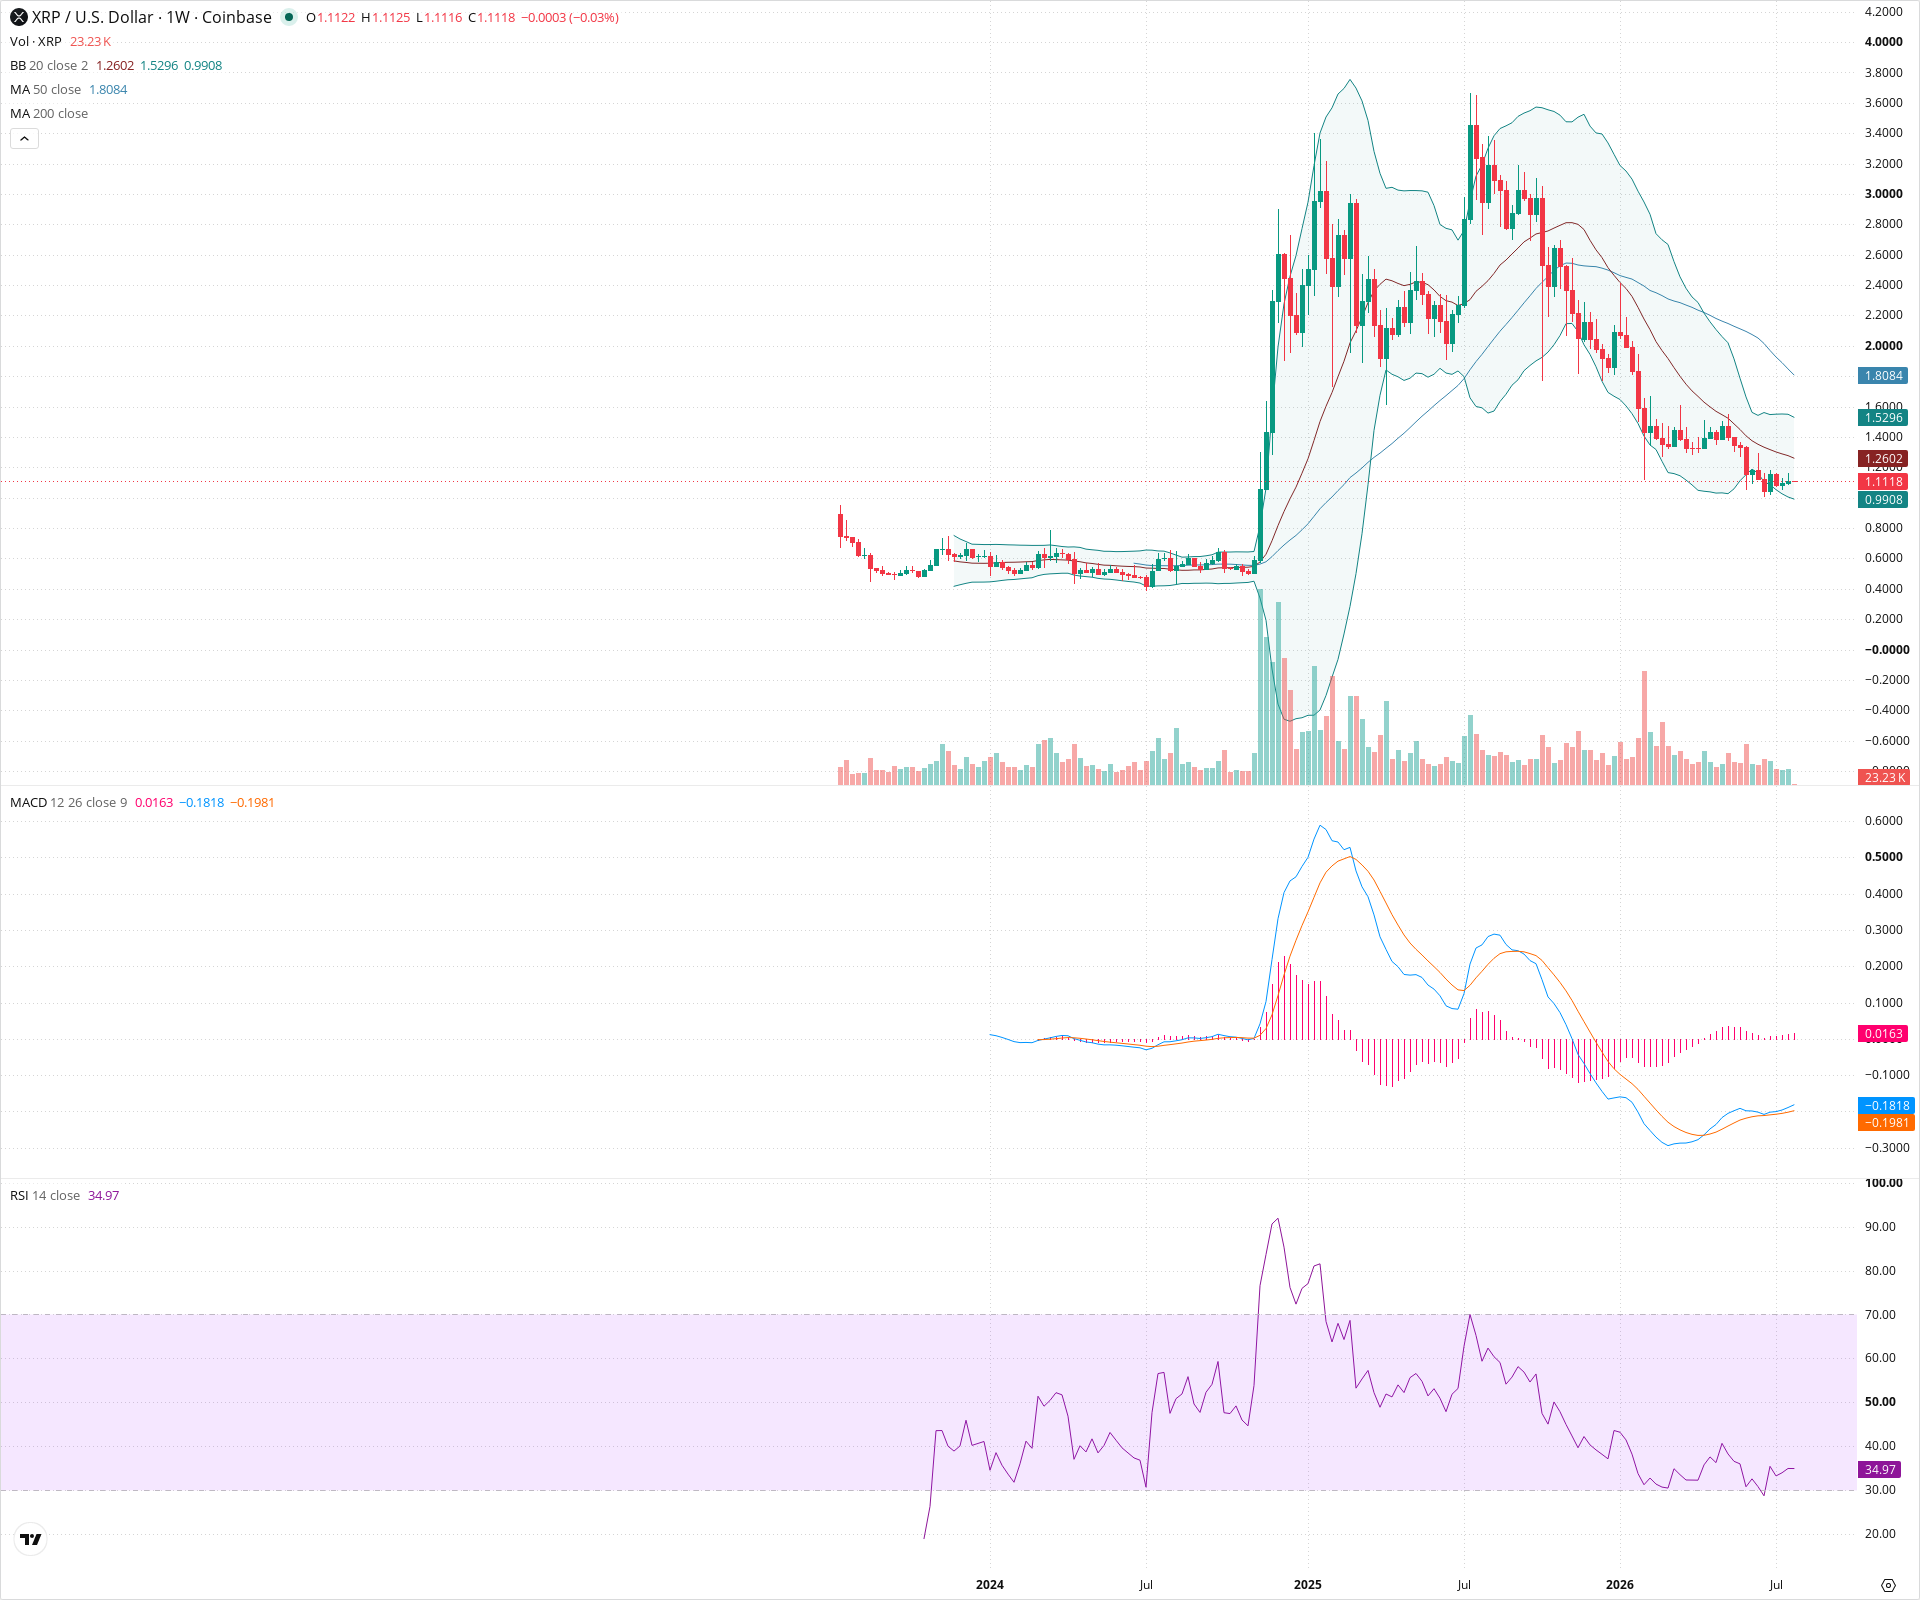
XRP is currently in a severe long-term downtrend following a parabolic blow-off top. The asset is trading well below its 50-week SMA, with momentum indicators firmly in bearish territory. While RSI is nearing oversold levels and the MACD histogram shows waning downside momentum, suggesting potential for short-term relief bounces, the overall multi-month structural bias remains heavily bearish until significant overhead resistance is broken.
Included In Lists
Related Tickers of Interest
XRP Weekly Chart
Sentiment
Short-term Sentiment (days to weeks): Bearish
Price remains in a clear downtrend, hugging the lower Bollinger Band and consistently making lower highs and lower lows. RSI is weak, though near oversold levels.
Long-term Sentiment (weeks to months): Bearish
The chart shows a massive parabolic advance that has completely broken down. Price is trading significantly below a sharply declining 50-week SMA, indicating a prolonged markdown phase.
Report Metadata
- Timeframe: weekly
- Generated at: 2026-07-27T00:02:07.898Z
- Model: gemini-3.1-pro-preview
Support Price Levels
| Level | Range | Strength | Notes |
|---|---|---|---|
| $1.03 | $0.95 - $1.10 | Weak | Immediate area of recent lows and psychological round number. |
| $0.55 | $0.45 - $0.65 | Strong | Major historical consolidation zone established prior to the massive breakout in early 2025. |
Resistance Price Levels
| Level | Range | Strength | Notes |
|---|---|---|---|
| $1.50 | $1.40 - $1.60 | Moderate | Recent breakdown zone and area of previous lower highs acting as immediate overhead supply. |
| $1.90 | $1.80 - $2.00 | Strong | Confluence of a major previous support-turned-resistance shelf and the current trajectory of the 50-week SMA. |
Potential Chart Patterns in Formation
| Strength | Pattern | Signal | Target | Details |
|---|---|---|---|---|
| Strong | Markdown Phase / Sustained Downtrend | Bearish | N/A | Following a blow-off top, the asset has entered a relentless multi-month structural downtrend defined by a steep descending channel and failure to hold key support levels. |
Frequently Asked Questions about XRP
What is the current sentiment for XRP?
The short-term sentiment for XRP is currently Bearish because Price remains in a clear downtrend, hugging the lower Bollinger Band and consistently making lower highs and lower lows. RSI is weak, though near oversold levels.. The long-term trend is classified as Bearish.
What are the key support levels for XRP?
StockDips.AI has identified key support levels for XRP at $1.03 and $0.55. These levels may represent potential accumulation zones where buying interest could emerge.
Is XRP in a significant dip or a Value Dip right now?
XRP has a Value Score of 75/100. It is currently flagged as a significant dip in the Top Dips list. It is not listed as a Value Dip because the long-term sentiment or value-score threshold does not qualify.
View the full interactive analysis on StockDips.AI.