ZEC Weekly Technical Analysis
ZCash
Zcash (ZEC) is a privacy-focused cryptocurrency that enables optional anonymity for transactions by using advanced cryptography. While the Zcash protocol governs the network, ZEC is the native monetary unit, or coin, used for transactions.
ZEC Technical Analysis Summary
ZEC is in a strong long-term uptrend, having broken out of a massive multi-year base. The current weekly chart shows a healthy, albeit highly volatile, macro consolidation phase (a large bull flag or pennant) digesting the previous parabolic move. As long as price maintains structure above the rising 50-week SMA, the long-term bias remains heavily skewed toward eventual continuation upward.
Included In Lists
Related Tickers of Interest
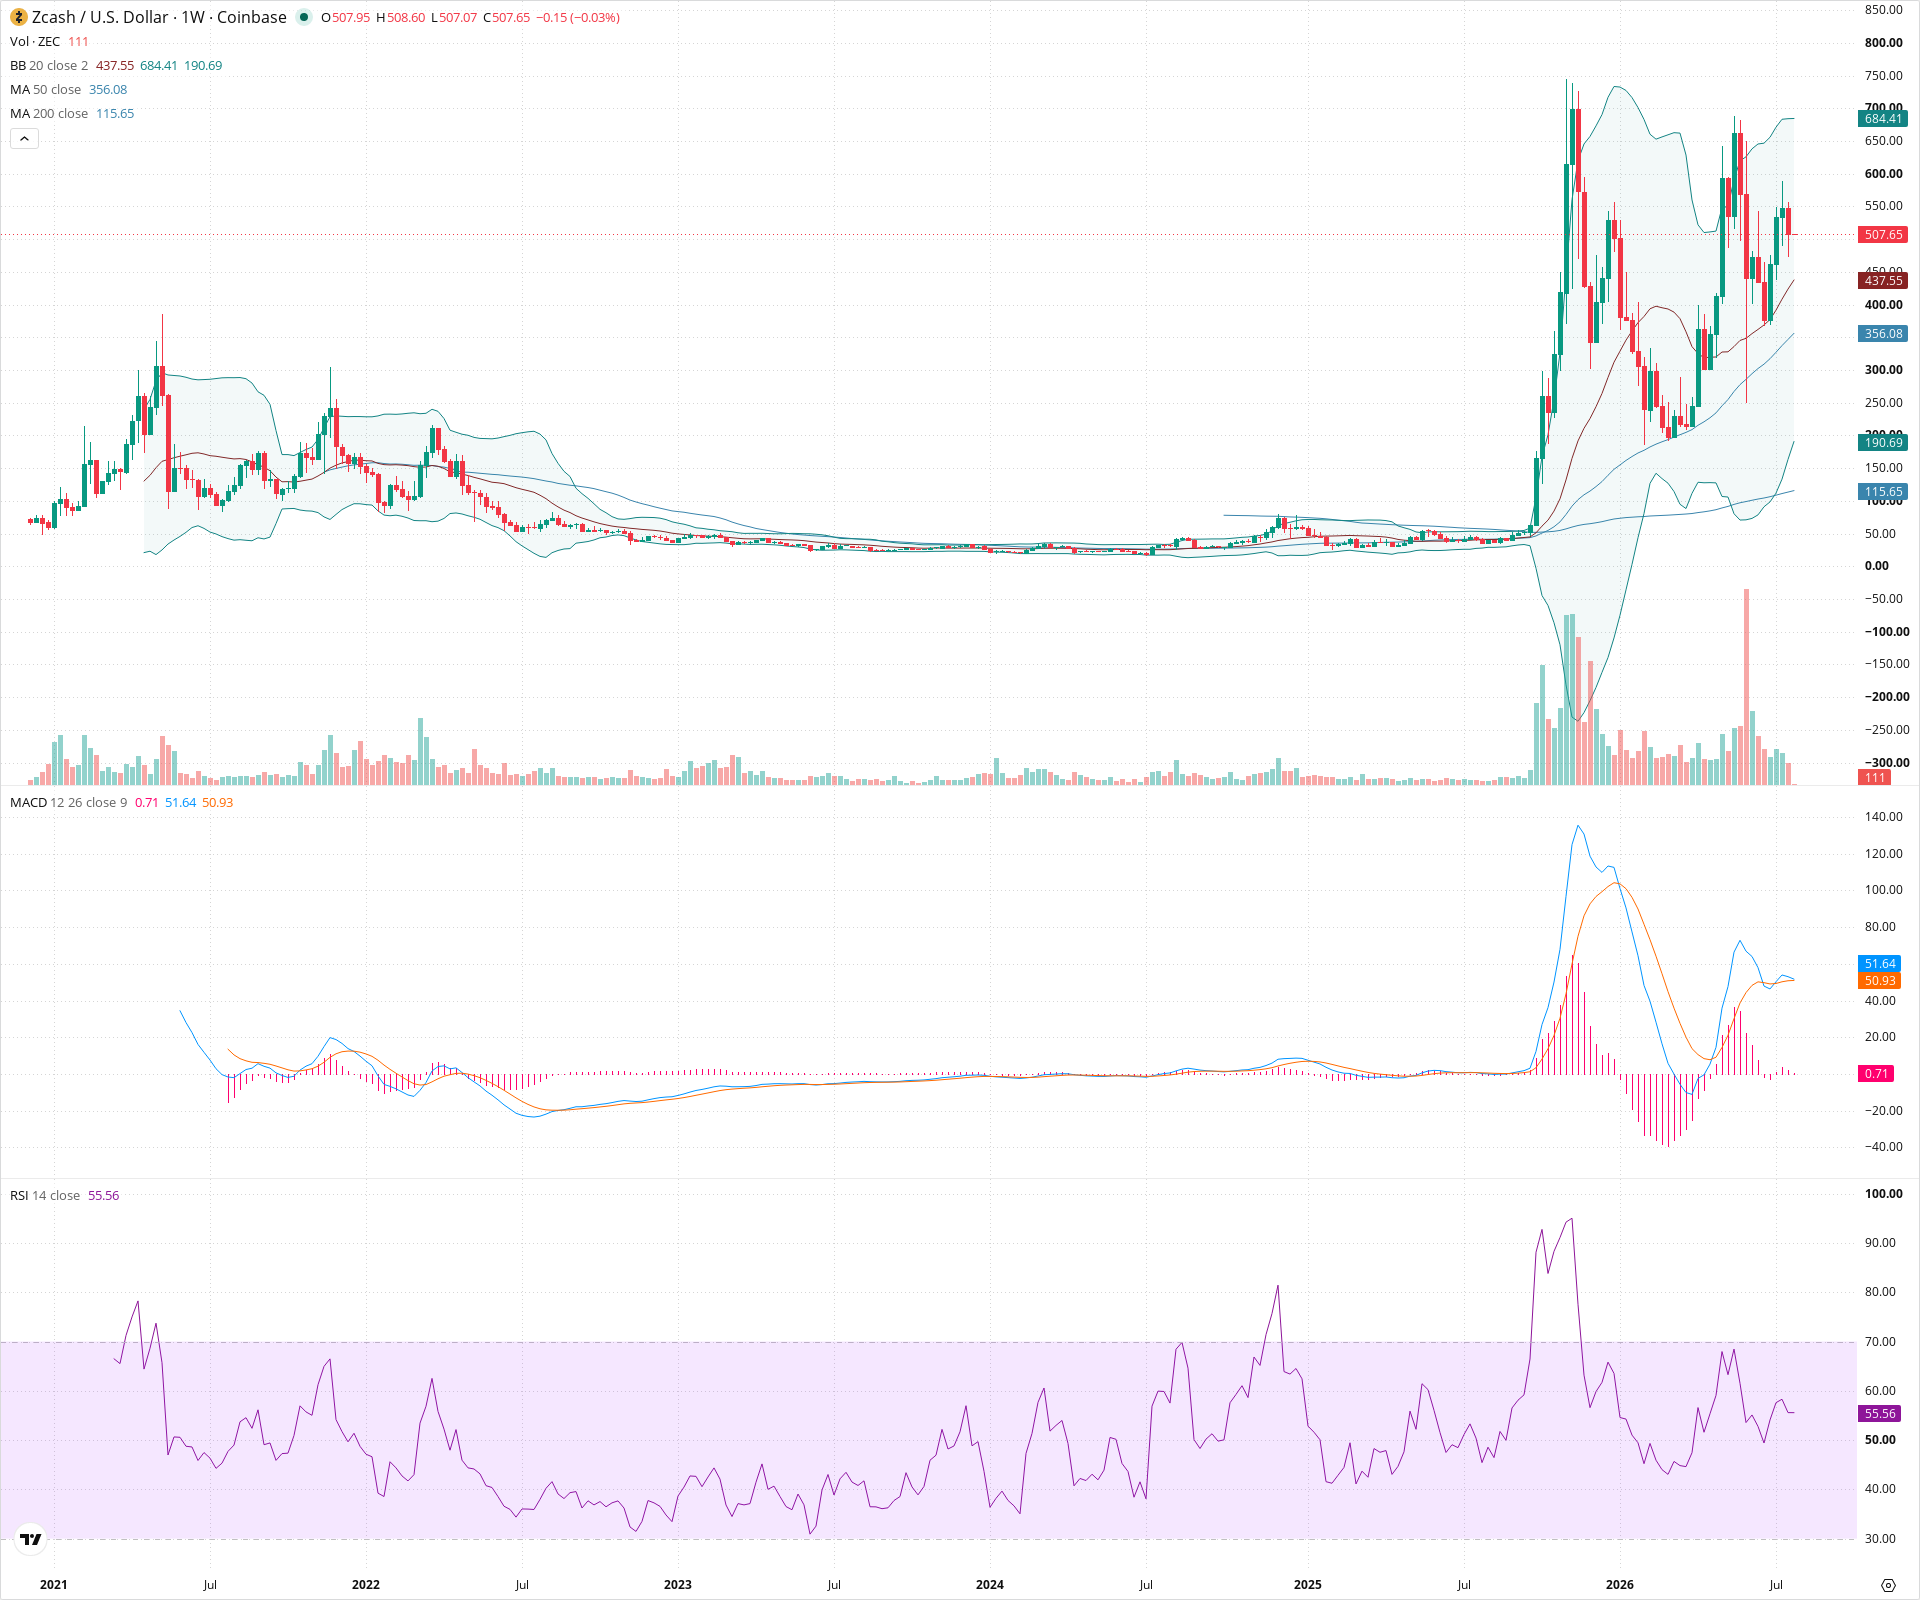
ZEC Weekly Chart
Sentiment
Short-term Sentiment (days to weeks): Neutral
Price is consolidating in a volatile, sideways range after a massive run-up. RSI has cooled to neutral territory near 55, and the MACD histogram is nearly flat, indicating a pause in short-term momentum as price compresses between the 20-week SMA support and recent lower highs.
Long-term Sentiment (weeks to months): Bullish
The macro trend is strongly up, characterized by a massive breakout from a multi-year base. Price remains well above upward-sloping 50-week and 200-week SMAs, which recently formed a 'Golden Cross'. The current action appears to be a large-scale consolidation pattern within a dominant bull market.
Report Metadata
- Timeframe: weekly
- Generated at: 2026-07-27T00:04:00.999Z
- Model: gemini-3.1-pro-preview
Support Price Levels
| Level | Range | Strength | Notes |
|---|---|---|---|
| $420.00 | $400.00 - $440.00 | Strong | Confluence of recent swing lows during the current consolidation phase and the rising 20-week SMA (middle Bollinger Band). |
| $365.00 | $350.00 - $380.00 | Strong | Area of the rising 50-week SMA and a prior structural swing low formed during the initial pullback from the peak. |
| $175.00 | $150.00 - $200.00 | Strong | Major structural support zone representing the breakout level from the prior multi-year consolidation base. |
Resistance Price Levels
| Level | Range | Strength | Notes |
|---|---|---|---|
| $700.00 | $680.00 - $720.00 | Strong | Upper boundary of the recent consolidation range and proximity to the upper Bollinger Band. |
| $810.00 | $800.00 - $820.00 | Strong | The absolute macro peak; represents major psychological and structural resistance. |
Potential Chart Patterns in Formation
| Strength | Pattern | Signal | Target | Details |
|---|---|---|---|---|
| Strong | Bull Pennant / Flag | Bullish | N/A | Following a near-vertical, parabolic advance, the price is consolidating by forming a series of broadly lower highs and higher lows, digesting the massive gains while holding above key moving averages. |
Frequently Asked Questions about ZEC
What is the current sentiment for ZEC?
The short-term sentiment for ZEC is currently Neutral because Price is consolidating in a volatile, sideways range after a massive run-up. RSI has cooled to neutral territory near 55, and the MACD histogram is nearly flat, indicating a pause in short-term momentum as price compresses between the 20-week SMA support and recent lower highs.. The long-term trend is classified as Bullish.
What are the key support levels for ZEC?
StockDips.AI has identified key support levels for ZEC at $420.00 and $365.00. These levels may represent potential accumulation zones where buying interest could emerge.
Is ZEC in a significant dip or a Value Dip right now?
ZEC has a Value Score of 67/100. It is not currently flagged as a significant dip in the Top Dips list. It is not listed as a Value Dip because the long-term sentiment or value-score threshold does not qualify.
View the full interactive analysis on StockDips.AI.