BNB Daily Technical Analysis
Binance Coin
Utility token of the Binance ecosystem, used for transaction fees and blockchain operations.
This is a historical daily technical analysis report for BNB, generated on July 25, 2026 at 12:02 PM UTC.
BNB Technical Analysis Summary
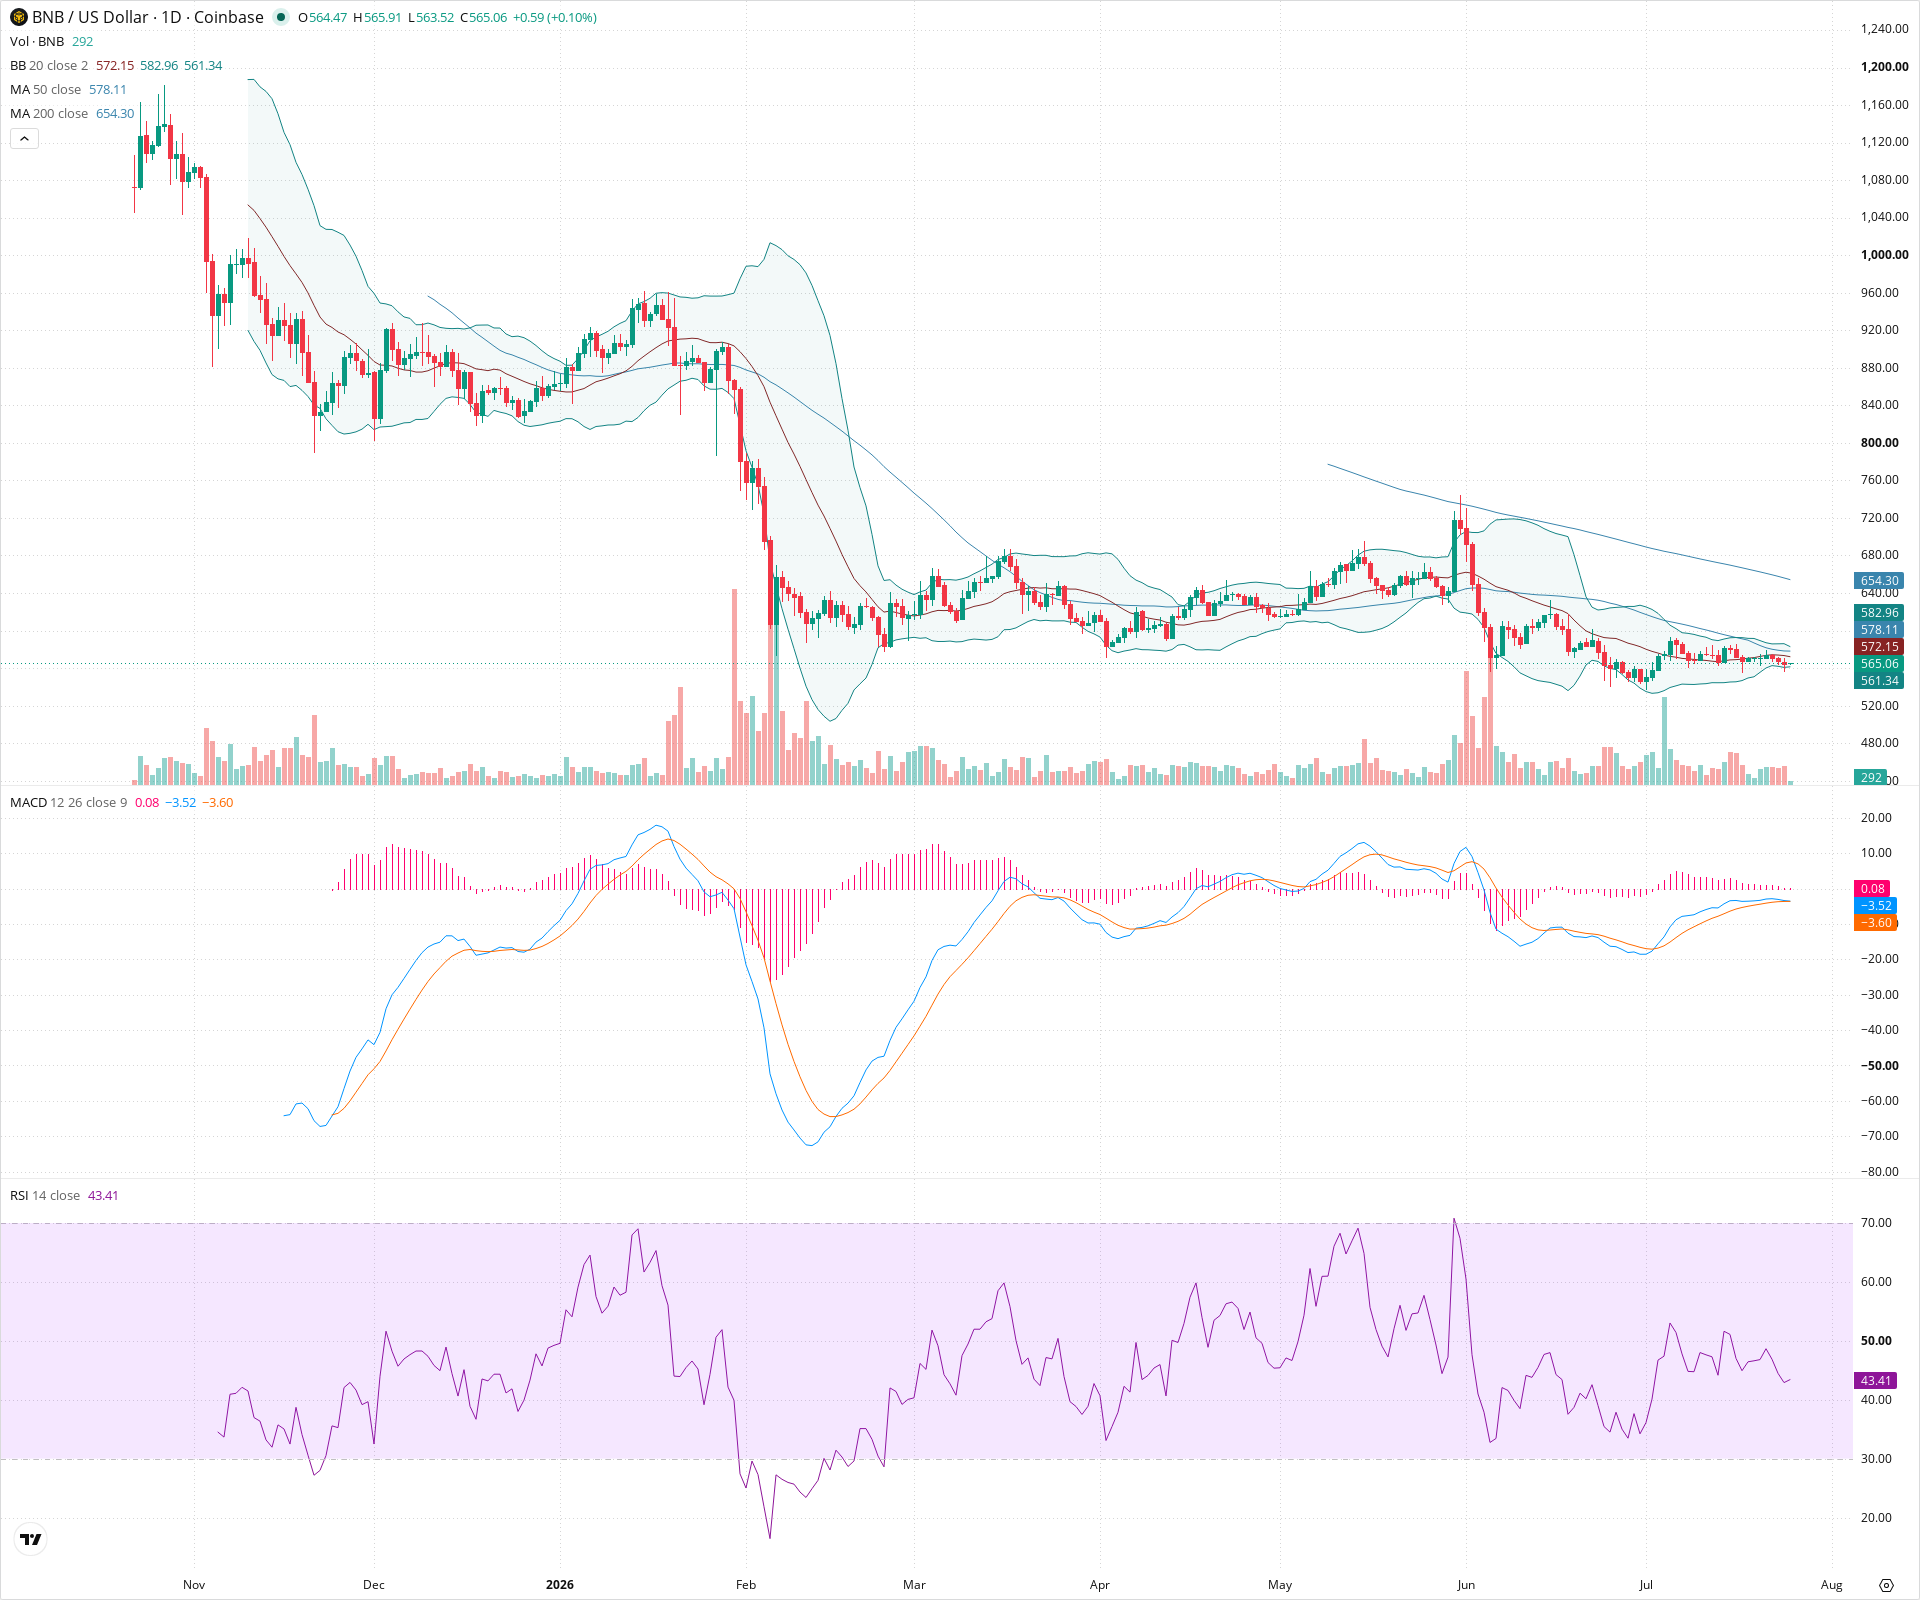
BNB is currently entrenched in a severe, long-term downtrend across the daily timeframe. Price action is capped by all major moving averages, with the 50-day SMA acting as consistent dynamic resistance. While short-term momentum indicators like the MACD and RSI suggest selling pressure may be temporarily exhausted at current levels, the overarching market structure remains firmly bearish until a significant higher high is established above the 600 level.
Included In Lists
Related Tickers of Interest
Historical Report Navigation
Browse adjacent archived reports or jump back to the latest live analysis page.
BNB Daily Chart
Sentiment
Short-term Sentiment (days to weeks): Bearish
Price remains below the 20-day and 50-day SMAs, forming a series of lower highs and lower lows. While the MACD histogram shows waning downward momentum, the overall short-term price structure is still negative.
Long-term Sentiment (weeks to months): Bearish
The asset is in a pronounced, multi-month downtrend, trading significantly below a downward-sloping 200-day SMA, indicating sustained long-term selling pressure.
Report Metadata
- Timeframe: daily
- Generated at: Jul 25, 2026
- Model: gemini-3.1-pro-preview
Support Price Levels
| Level | Range | Strength | Notes |
|---|---|---|---|
| $557.50 | $550.00 - $565.00 | Weak | Current local support zone aligning with recent swing lows and the lower Bollinger Band. |
| $500.00 | $480.00 - $520.00 | Weak | Previous consolidation area from late February/early March; acts as the next logical downside target if current lows fail. |
Resistance Price Levels
| Level | Range | Strength | Notes |
|---|---|---|---|
| $587.50 | $575.00 - $600.00 | Strong | Immediate overhead resistance zone comprising the 20-day SMA, 50-day SMA, and recent minor swing highs. |
| $665.00 | $650.00 - $680.00 | Strong | Major structural resistance zone where a significant breakdown occurred in early June, also coinciding with the descending 200-day SMA. |
Potential Chart Patterns in Formation
| Strength | Pattern | Signal | Target | Details |
|---|---|---|---|---|
| Weak | Bear Flag / Consolidation | Bearish | N/A | A period of weak, sideways-to-slightly-upward consolidation following a sharp price drop in early June, potentially signaling a pause before further downward continuation. |
| Strong | Descending Channel | Bearish | N/A | The broader price action since March forms a clear descending structure with consistent lower highs, constrained by the 50-day moving average. |
Frequently Asked Questions about BNB
What is the current sentiment for BNB?
The short-term sentiment for BNB is currently Bearish because Price remains below the 20-day and 50-day SMAs, forming a series of lower highs and lower lows. While the MACD histogram shows waning downward momentum, the overall short-term price structure is still negative. The long-term trend is classified as Bearish.
What are the key support levels for BNB?
StockDips.AI has identified key support levels for BNB at $557.50 and $500.00. These levels may represent potential accumulation zones where buying interest could emerge.
Is BNB in a significant dip or a Value Dip right now?
BNB has a Value Score of 70/100. It is currently flagged as a significant dip in the Top Dips list. It is not listed as a Value Dip because the long-term sentiment or value-score threshold does not qualify.
View the full interactive analysis on StockDips.AI.