BNB Daily Technical Analysis
Binance Coin
Utility token of the Binance ecosystem, used for transaction fees and blockchain operations.
This is a historical daily technical analysis report for BNB, generated on July 27, 2026 at 12:02 AM UTC.
BNB Technical Analysis Summary
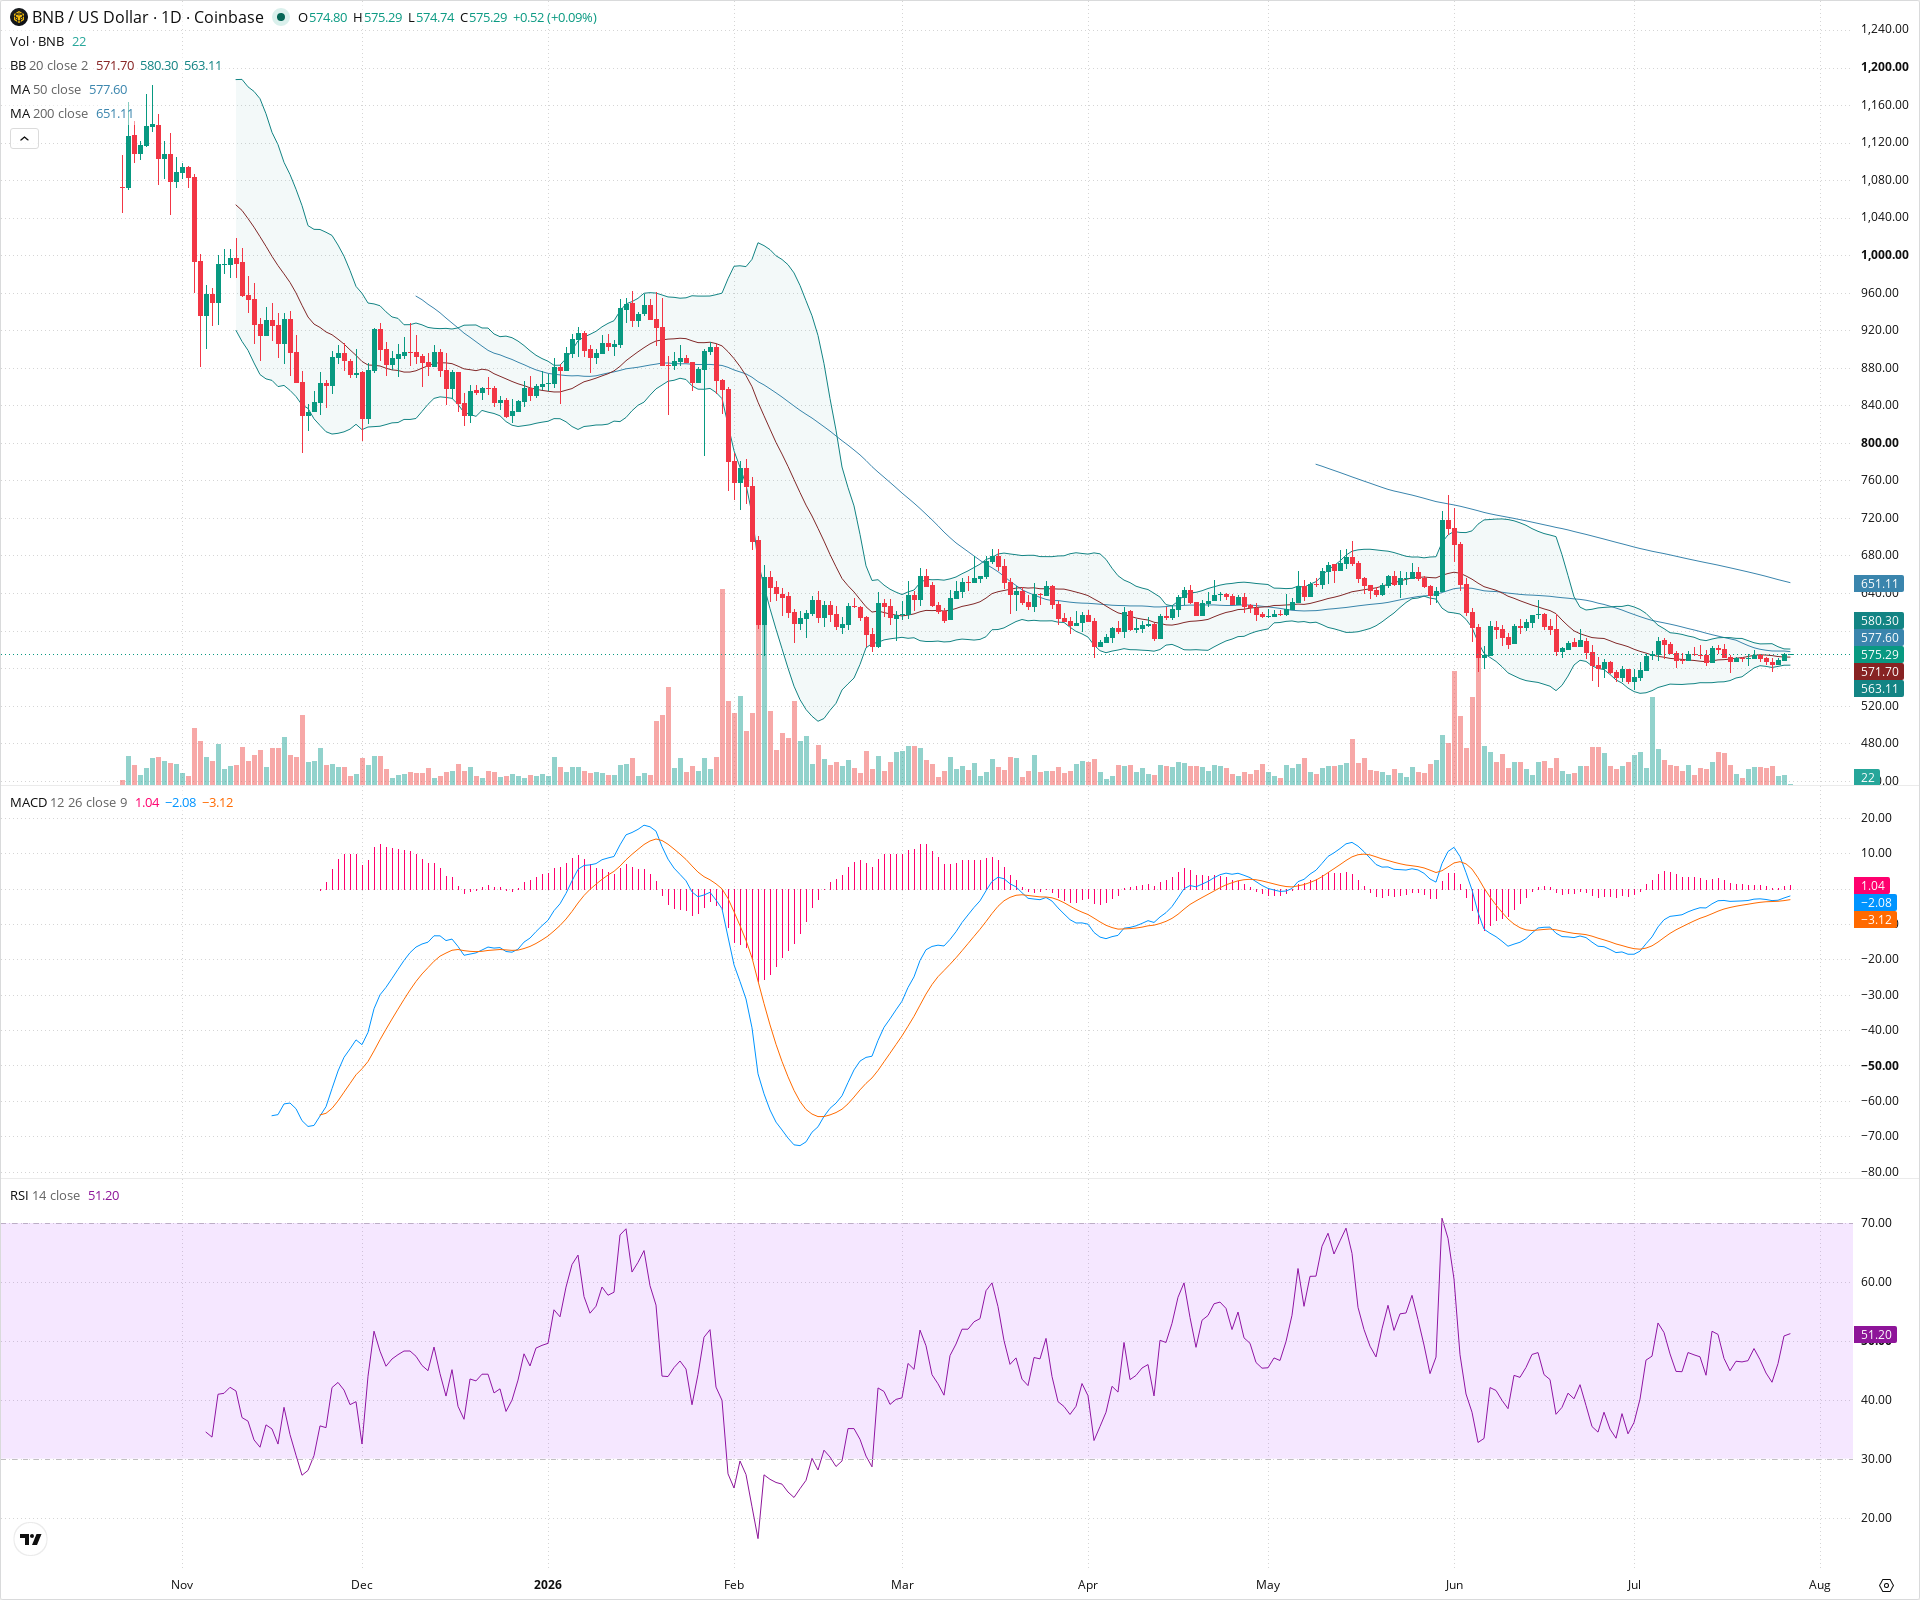
BNB is currently experiencing a period of extreme low volatility, resulting in a tight consolidation phase following a prolonged downtrend. While the short-term picture is neutral as the market awaits a breakout from the Bollinger Band squeeze, the long-term outlook remains bearish as price is firmly capped below key moving averages like the 200-day SMA. A decisive break of the immediate support or resistance levels will likely dictate the next significant trend direction.
Included In Lists
Related Tickers of Interest
Historical Report Navigation
Browse adjacent archived reports or jump back to the latest live analysis page.
BNB Daily Chart
Sentiment
Short-term Sentiment (days to weeks): Neutral
Price is currently consolidating in a very tight range, caught between the 20-day and 50-day SMAs. Momentum indicators like RSI are flat near 50, and MACD shows minimal divergence, indicating a lack of clear near-term directional bias.
Long-term Sentiment (weeks to months): Bearish
The asset remains in a broader macro downtrend, trading significantly below a downward-sloping 200-day SMA. The market structure continues to exhibit lower highs over the past several months.
Report Metadata
- Timeframe: daily
- Generated at: Jul 27, 2026
- Model: gemini-3.1-pro-preview
Support Price Levels
| Level | Range | Strength | Notes |
|---|---|---|---|
| $565.00 | $560.00 - $570.00 | Weak | Immediate support zone defined by the lows of the current tight consolidation phase. |
| $530.00 | $520.00 - $540.00 | Strong | Major historical support floor established by the extreme swing lows in February and retested during the June sell-off. |
Resistance Price Levels
| Level | Range | Strength | Notes |
|---|---|---|---|
| $600.00 | $590.00 - $610.00 | Weak | Immediate overhead resistance marking the top of the current consolidation box and aligning with prior minor peaks. |
| $650.00 | $640.00 - $660.00 | Strong | Significant resistance zone clustering around the declining 200-day SMA and a previous support-turned-resistance area. |
Potential Chart Patterns in Formation
| Strength | Pattern | Signal | Target | Details |
|---|---|---|---|---|
| Strong | Bollinger Band Squeeze | Neutral | N/A | The Bollinger Bands have contracted significantly around the current price action, indicating a period of abnormally low volatility. |
| Weak | Short-term Descending Triangle | Bearish | N/A | A series of lower highs has formed since mid-June against a relatively flat horizontal support base near the 560 level. |
Frequently Asked Questions about BNB
What is the current sentiment for BNB?
The short-term sentiment for BNB is currently Neutral because Price is currently consolidating in a very tight range, caught between the 20-day and 50-day SMAs. Momentum indicators like RSI are flat near 50, and MACD shows minimal divergence, indicating a lack of clear near-term directional bias. The long-term trend is classified as Bearish.
What are the key support levels for BNB?
StockDips.AI has identified key support levels for BNB at $565.00 and $530.00. These levels may represent potential accumulation zones where buying interest could emerge.
Is BNB in a significant dip or a Value Dip right now?
BNB has a Value Score of 71/100. It is currently flagged as a significant dip in the Top Dips list. It is not listed as a Value Dip because the long-term sentiment or value-score threshold does not qualify.
View the full interactive analysis on StockDips.AI.