BNB Daily Technical Analysis
Binance Coin
Utility token of the Binance ecosystem, used for transaction fees and blockchain operations.
This is a historical daily technical analysis report for BNB, generated on September 21, 2026 at 12:00 AM UTC.
BNB Technical Analysis Summary
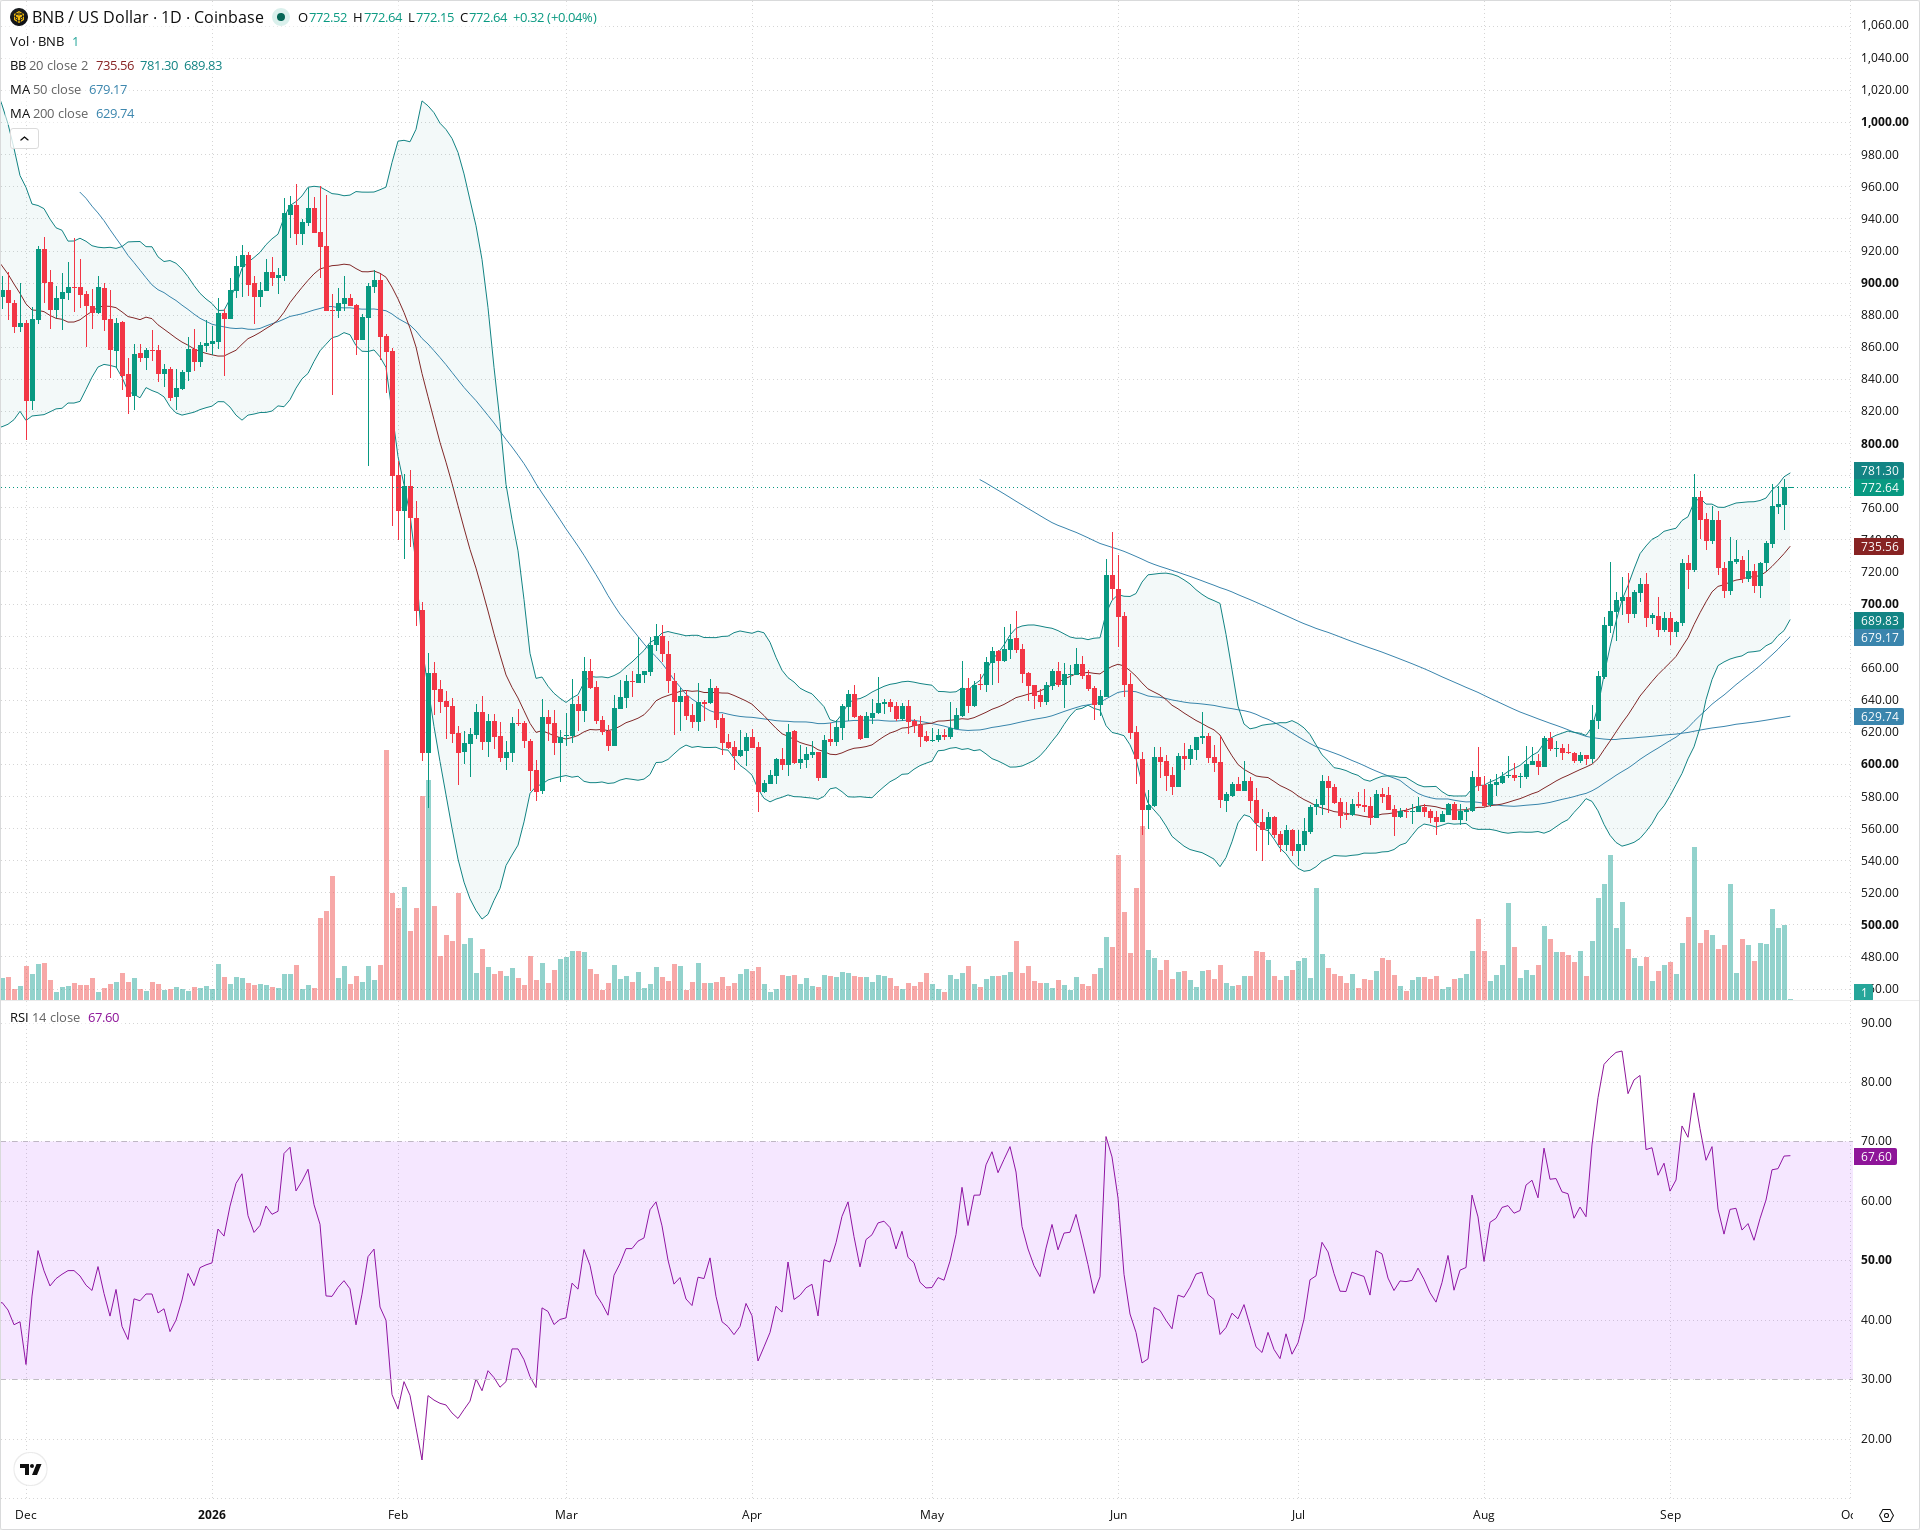
BNB is in a decisive daily uptrend, maintaining position well above its rising 20-day, 50-day, and 200-day moving averages following a sustained multi-month recovery. Price recently rebounded cleanly from the 20-day SMA/support zone near $715–$735 and is pushing toward the recent high near $781. A sustained breakout above the current upper resistance band could pave the way for a test of major historical resistance around $830–$850.
Included In Lists
Related Tickers of Interest
Historical Report Navigation
Browse adjacent archived reports or jump back to the latest live analysis page.
BNB Daily Chart
Sentiment
Short-term Sentiment (days to weeks): Bullish
Price is rebounding strongly above the 20-day SMA towards the upper Bollinger Band, with RSI rising near 67.60 confirming positive upward momentum.
Long-term Sentiment (weeks to months): Bullish
Price trades well above both upward-sloping 50-day and 200-day SMAs, forming a major higher-low structure after bottoming out in July.
Report Metadata
- Timeframe: daily
- Generated at: Sep 21, 2026
- Model: gemini-3.8-flash
Support Price Levels
| Level | Range | Strength | Notes |
|---|---|---|---|
| $725.28 | $715.00 - $735.56 | Strong | Confluence of recent swing low pullback and the 20-day SMA middle Bollinger Band. |
| $679.92 | $670.00 - $689.83 | Moderate | Aligned with the rising 50-day SMA and lower Bollinger Band zone. |
| $630.00 | $625.00 - $635.00 | Strong | Major structural breakout level and intersection with the 200-day SMA. |
Resistance Price Levels
| Level | Range | Strength | Notes |
|---|---|---|---|
| $778.15 | $775.00 - $781.30 | Moderate | Upper Bollinger Band boundary and immediate multi-day high. |
| $840.00 | $830.00 - $850.00 | Strong | Historical breakdown point and prior consolidation resistance from January. |
Potential Chart Patterns in Formation
| Strength | Pattern | Signal | Target | Details |
|---|---|---|---|---|
| Moderate | Bull Flag / Consolidation Breakout | Bullish | $840.00 | After a strong impulsive move upwards in late August, price consolidated into a brief flag/pullback to the 20-day SMA before resuming upward momentum. |
Frequently Asked Questions about BNB
What is the current sentiment for BNB?
The short-term sentiment for BNB is currently Bullish because Price is rebounding strongly above the 20-day SMA towards the upper Bollinger Band, with RSI rising near 67.60 confirming positive upward momentum. The long-term trend is classified as Bullish.
What are the key support levels for BNB?
StockDips.AI has identified key support levels for BNB at $725.28 and $679.92. These levels may represent potential accumulation zones where buying interest could emerge.
Is BNB in a significant dip or a Value Dip right now?
BNB has a Value Score of 71/100. It is currently flagged as a significant dip in the Top Dips list. It is also listed as a Value Dip because long-term sentiment is bullish.
View the full interactive analysis on StockDips.AI.