BNB Daily Technical Analysis
Binance Coin
Utility token of the Binance ecosystem, used for transaction fees and blockchain operations.
This is a historical daily technical analysis report for BNB, generated on September 26, 2026 at 12:01 AM UTC.
BNB Technical Analysis Summary
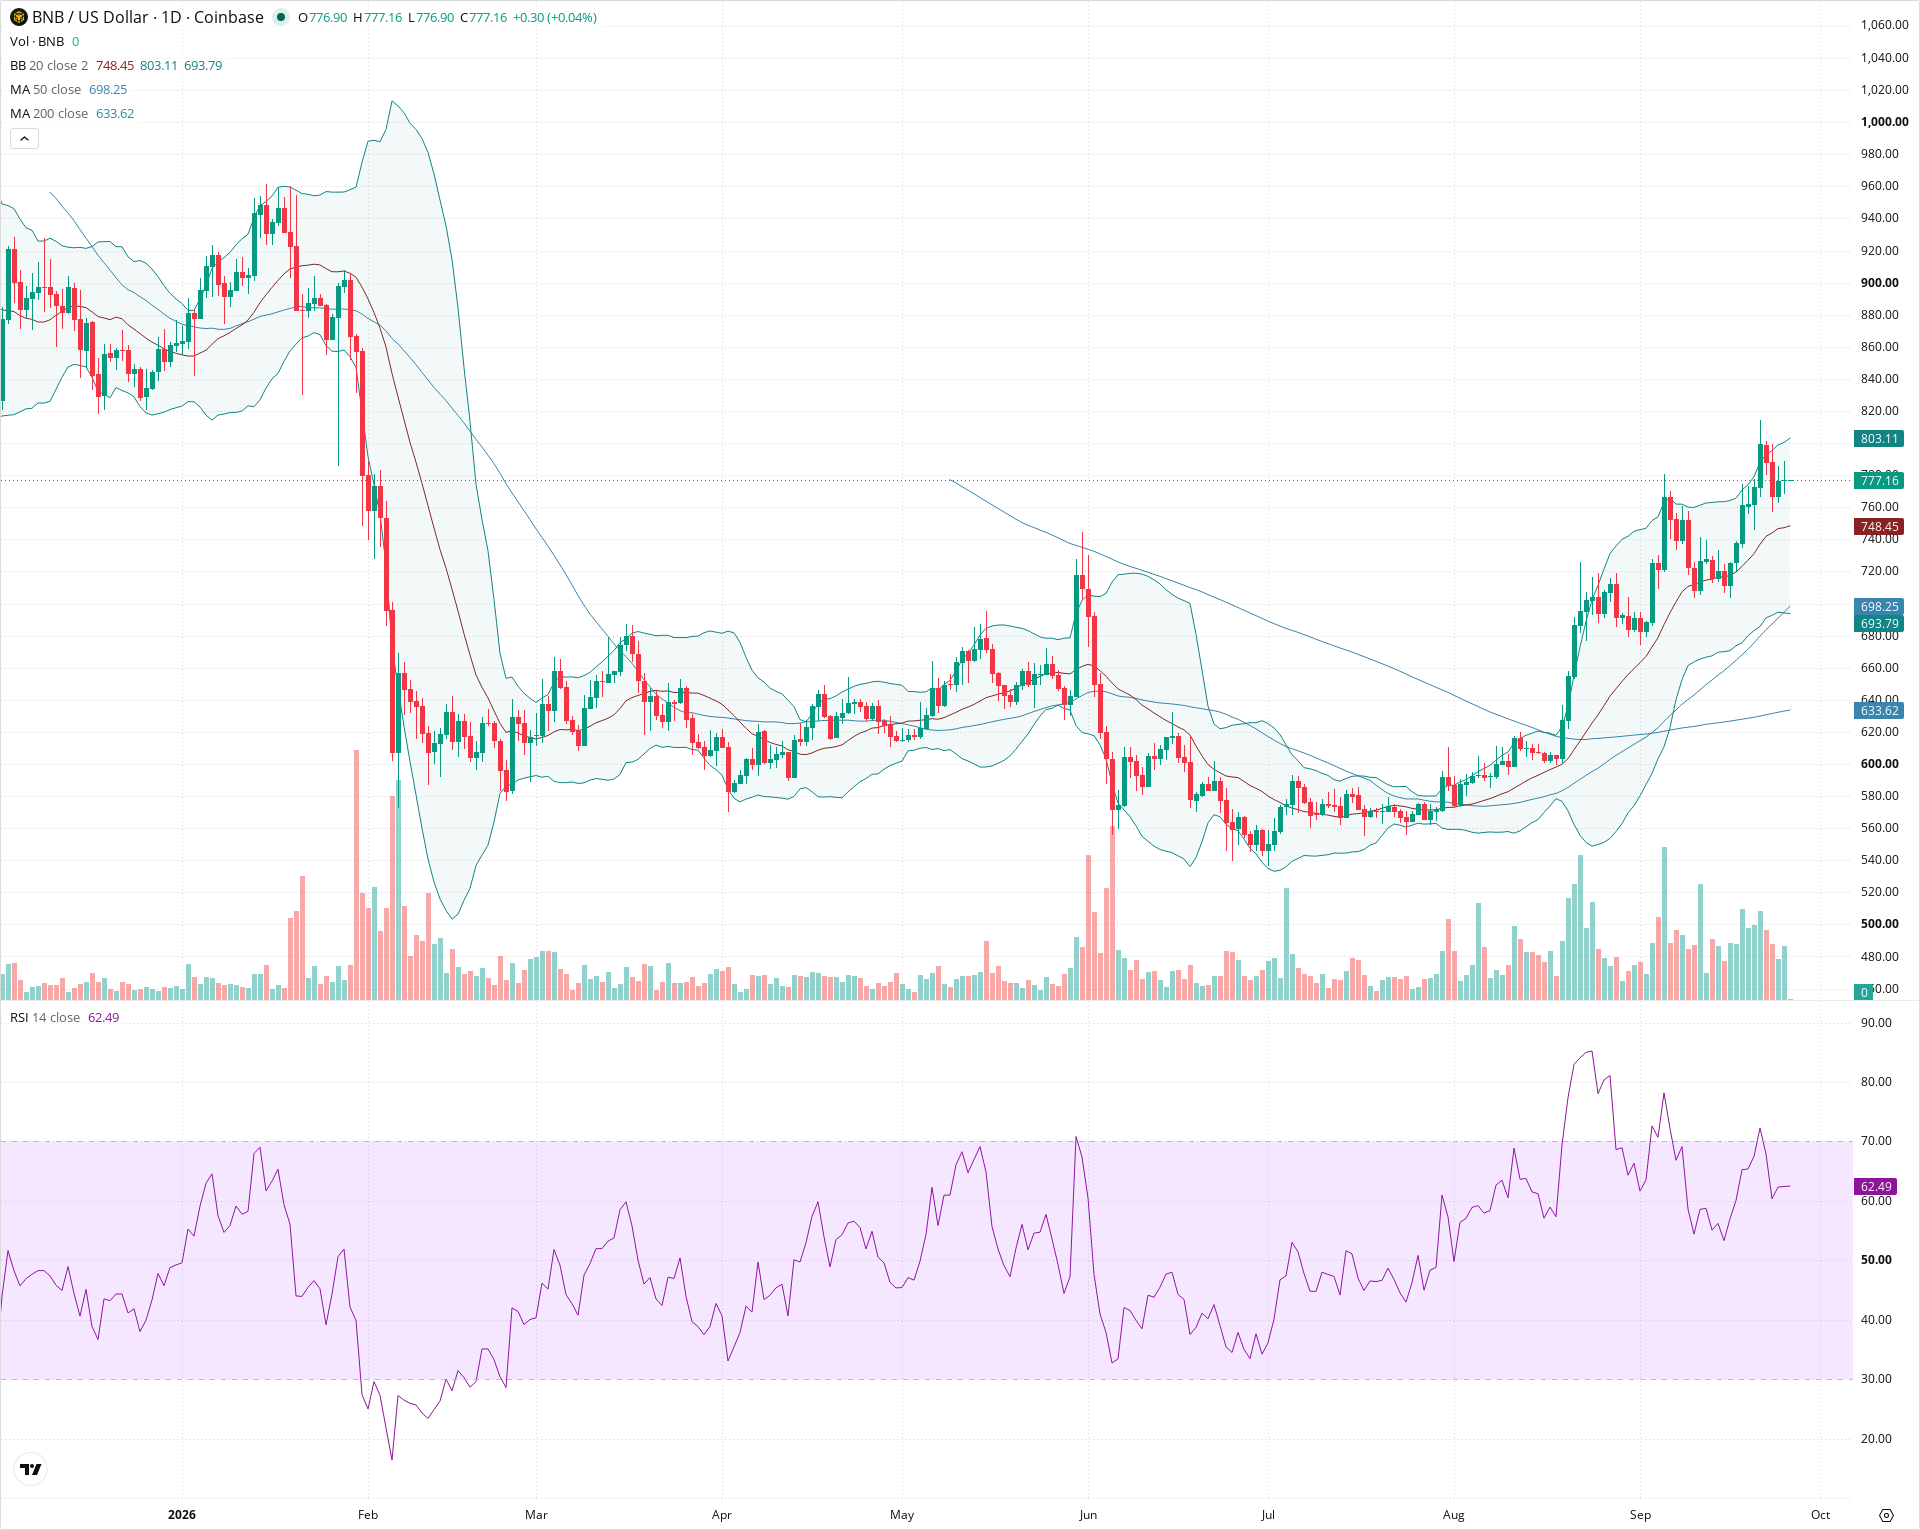
BNB shows strong upward momentum on the daily timeframe, holding firmly above its rising 20-day, 50-day, and 200-day moving averages following a steady recovery from mid-year lows. Although facing overhead resistance around 800.00-815.00, key support between 740.00 and 750.00 remains intact. As long as price maintains structure above the moving average cluster, the broader technical outlook favors further upside toward the 880.00 resistance region.
Included In Lists
Related Tickers of Interest
Historical Report Navigation
Browse adjacent archived reports or jump back to the latest live analysis page.
BNB Daily Chart
Sentiment
Short-term Sentiment (days to weeks): Bullish
Price is trending upward above the 20-day SMA and upper half of Bollinger Bands, with RSI holding above 60 indicating solid bullish momentum despite recent minor consolidation.
Long-term Sentiment (weeks to months): Bullish
Price is trading well above both the rising 50-day SMA (698.25) and 200-day SMA (633.62), completing a golden cross recovery from the summer lows.
Report Metadata
- Timeframe: daily
- Generated at: Sep 26, 2026
- Model: gemini-3.8-flash
Support Price Levels
| Level | Range | Strength | Notes |
|---|---|---|---|
| $745.00 | $740.00 - $750.00 | Strong | Confluence of recent consolidation support and the 20-day SMA (748.45). |
| $692.50 | $685.00 - $700.00 | Moderate | Ascending 50-day SMA (698.25) and previous horizontal breakout level. |
Resistance Price Levels
| Level | Range | Strength | Notes |
|---|---|---|---|
| $807.50 | $800.00 - $815.00 | Strong | Recent swing high resistance aligned near the upper Bollinger Band boundary (803.11). |
| $890.00 | $880.00 - $900.00 | Moderate | Major prior breakdown level from early in the year. |
Potential Chart Patterns in Formation
| Strength | Pattern | Signal | Target | Details |
|---|---|---|---|---|
| Strong | Ascending Channel / Higher Highs and Higher Lows | Bullish | $880.00 | Consistent uptrend structure formed since August with higher highs and higher lows supported by the 20-day SMA. |
Frequently Asked Questions about BNB
What is the current sentiment for BNB?
The short-term sentiment for BNB is currently Bullish because Price is trending upward above the 20-day SMA and upper half of Bollinger Bands, with RSI holding above 60 indicating solid bullish momentum despite recent minor consolidation. The long-term trend is classified as Bullish.
What are the key support levels for BNB?
StockDips.AI has identified key support levels for BNB at $745.00 and $692.50. These levels may represent potential accumulation zones where buying interest could emerge.
Is BNB in a significant dip or a Value Dip right now?
BNB has a Value Score of 74/100. It is currently flagged as a significant dip in the Top Dips list. It is also listed as a Value Dip because long-term sentiment is bullish.
View the full interactive analysis on StockDips.AI.