TLT Weekly Technical Analysis
20+ Year Treasury Bond ETF
iShares 20+ Year Treasury Bond ETF - Invests in U.S. Treasury bonds with maturities of 20 years or more, often used for stability.
TLT Technical Analysis Summary
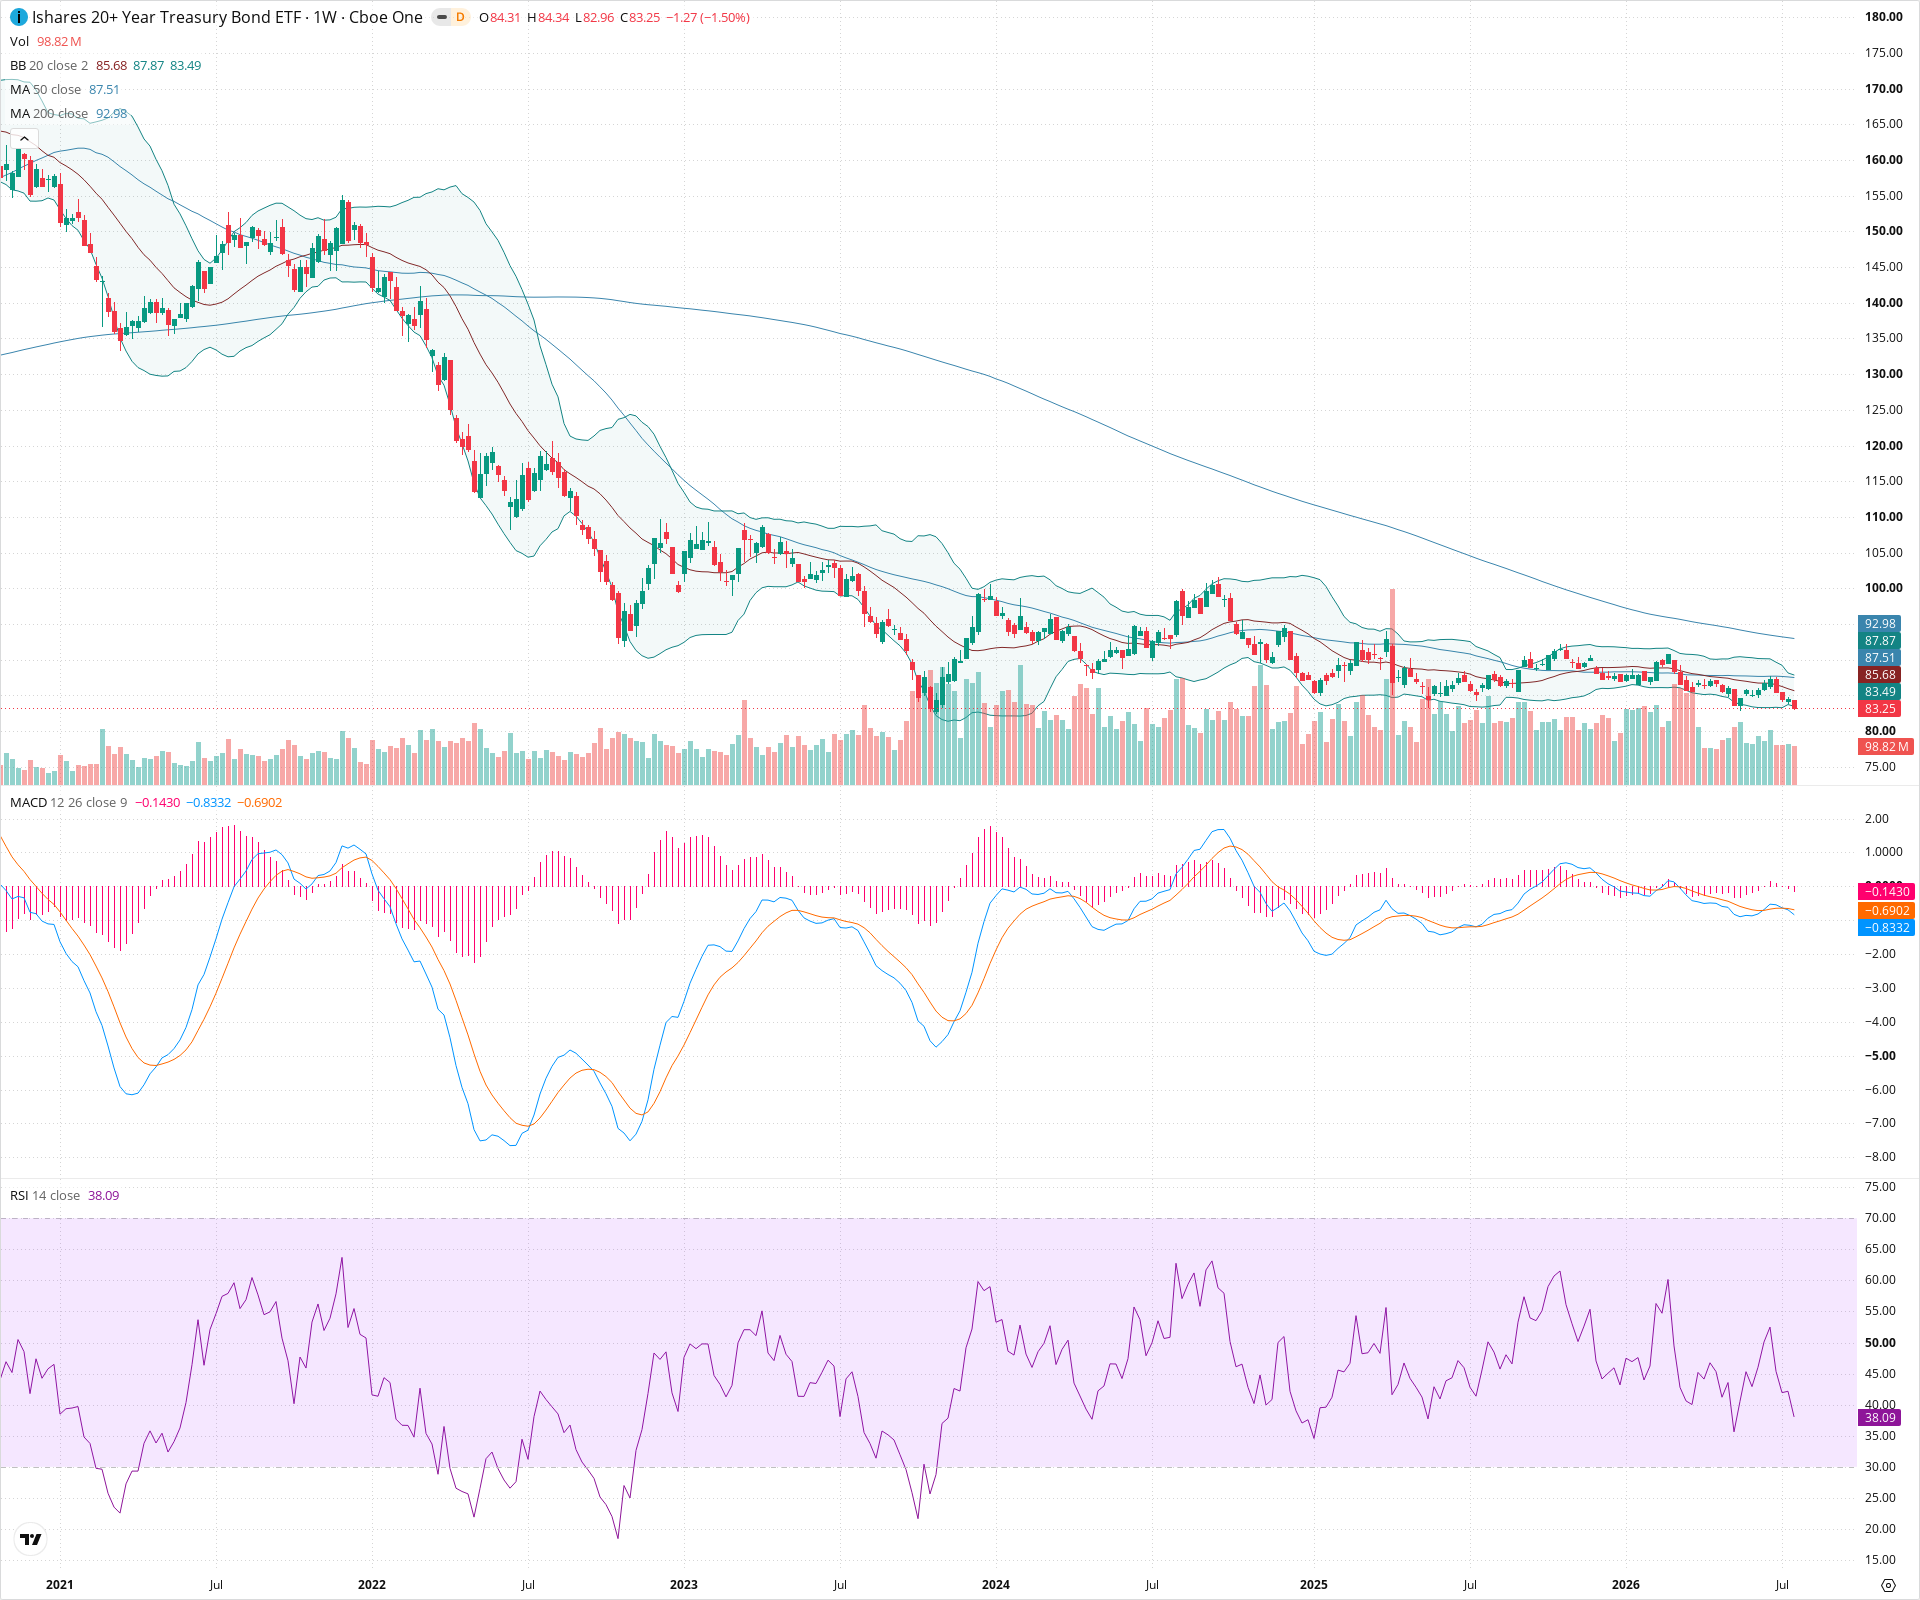
TLT remains entrenched in a dominant long-term downtrend, trading significantly below its 200-week SMA. In the medium term, price action has formed a bearish consolidation pattern, characterized by lower highs pressing against critical horizontal support in the 82-84 zone. With weekly momentum indicators like MACD and RSI confirming weakness, a decisive breakdown below current support levels would suggest a continuation of the primary macroeconomic downtrend.
Included In Lists
Related Tickers of Interest
TLT Weekly Chart
Sentiment
Short-term Sentiment (days to weeks): Bearish
Price is trading below declining 20-week and 50-week SMAs, MACD histogram is negative and expanding downwards, and RSI is weakening towards oversold territory as price pressures recent support lows.
Long-term Sentiment (weeks to months): Bearish
The chart displays a massive multi-year downtrend with structural lower highs and lower lows. Price remains well below a steeply declining 200-week SMA.
Report Metadata
- Timeframe: weekly
- Generated at: 2026-07-25T09:02:38.621Z
- Model: gemini-3.1-pro-preview
Support Price Levels
| Level | Range | Strength | Notes |
|---|---|---|---|
| $83.00 | $82.00 - $84.00 | Strong | Major multi-month structural support zone formed by the recent cycle lows. Price is currently testing this critical boundary. |
Resistance Price Levels
| Level | Range | Strength | Notes |
|---|---|---|---|
| $86.75 | $85.50 - $88.00 | Strong | Near-term overhead resistance formed by the confluence of the declining 20-week and 50-week SMAs, as well as recent minor swing highs. |
| $91.50 | $90.00 - $93.00 | Strong | Upper boundary of the recent multi-month consolidation range, reinforced by the approaching 200-week SMA. |
Potential Chart Patterns in Formation
| Strength | Pattern | Signal | Target | Details |
|---|---|---|---|---|
| Moderate | Descending Triangle / Bearish Consolidation | Bearish | N/A | Price is forming a series of lower highs while repeatedly testing a horizontal support zone near 82-84, indicating selling pressure is compressing price against support. |
Frequently Asked Questions about TLT
What is the current sentiment for TLT?
The short-term sentiment for TLT is currently Bearish because Price is trading below declining 20-week and 50-week SMAs, MACD histogram is negative and expanding downwards, and RSI is weakening towards oversold territory as price pressures recent support lows.. The long-term trend is classified as Bearish.
What are the key support levels for TLT?
StockDips.AI has identified key support levels for TLT at $83.00. These levels may represent potential accumulation zones where buying interest could emerge.
Is TLT in a significant dip or a Value Dip right now?
TLT has a Value Score of 100/100. It is not currently flagged as a significant dip in the Top Dips list. It is not listed as a Value Dip because the long-term sentiment or value-score threshold does not qualify.
View the full interactive analysis on StockDips.AI.