XRP Daily Technical Analysis
XRP
Designed for fast and low-cost cross-border payments and remittances.
This is a historical daily technical analysis report for XRP, generated on June 9, 2026 at 12:01 AM UTC.
XRP Technical Analysis Summary
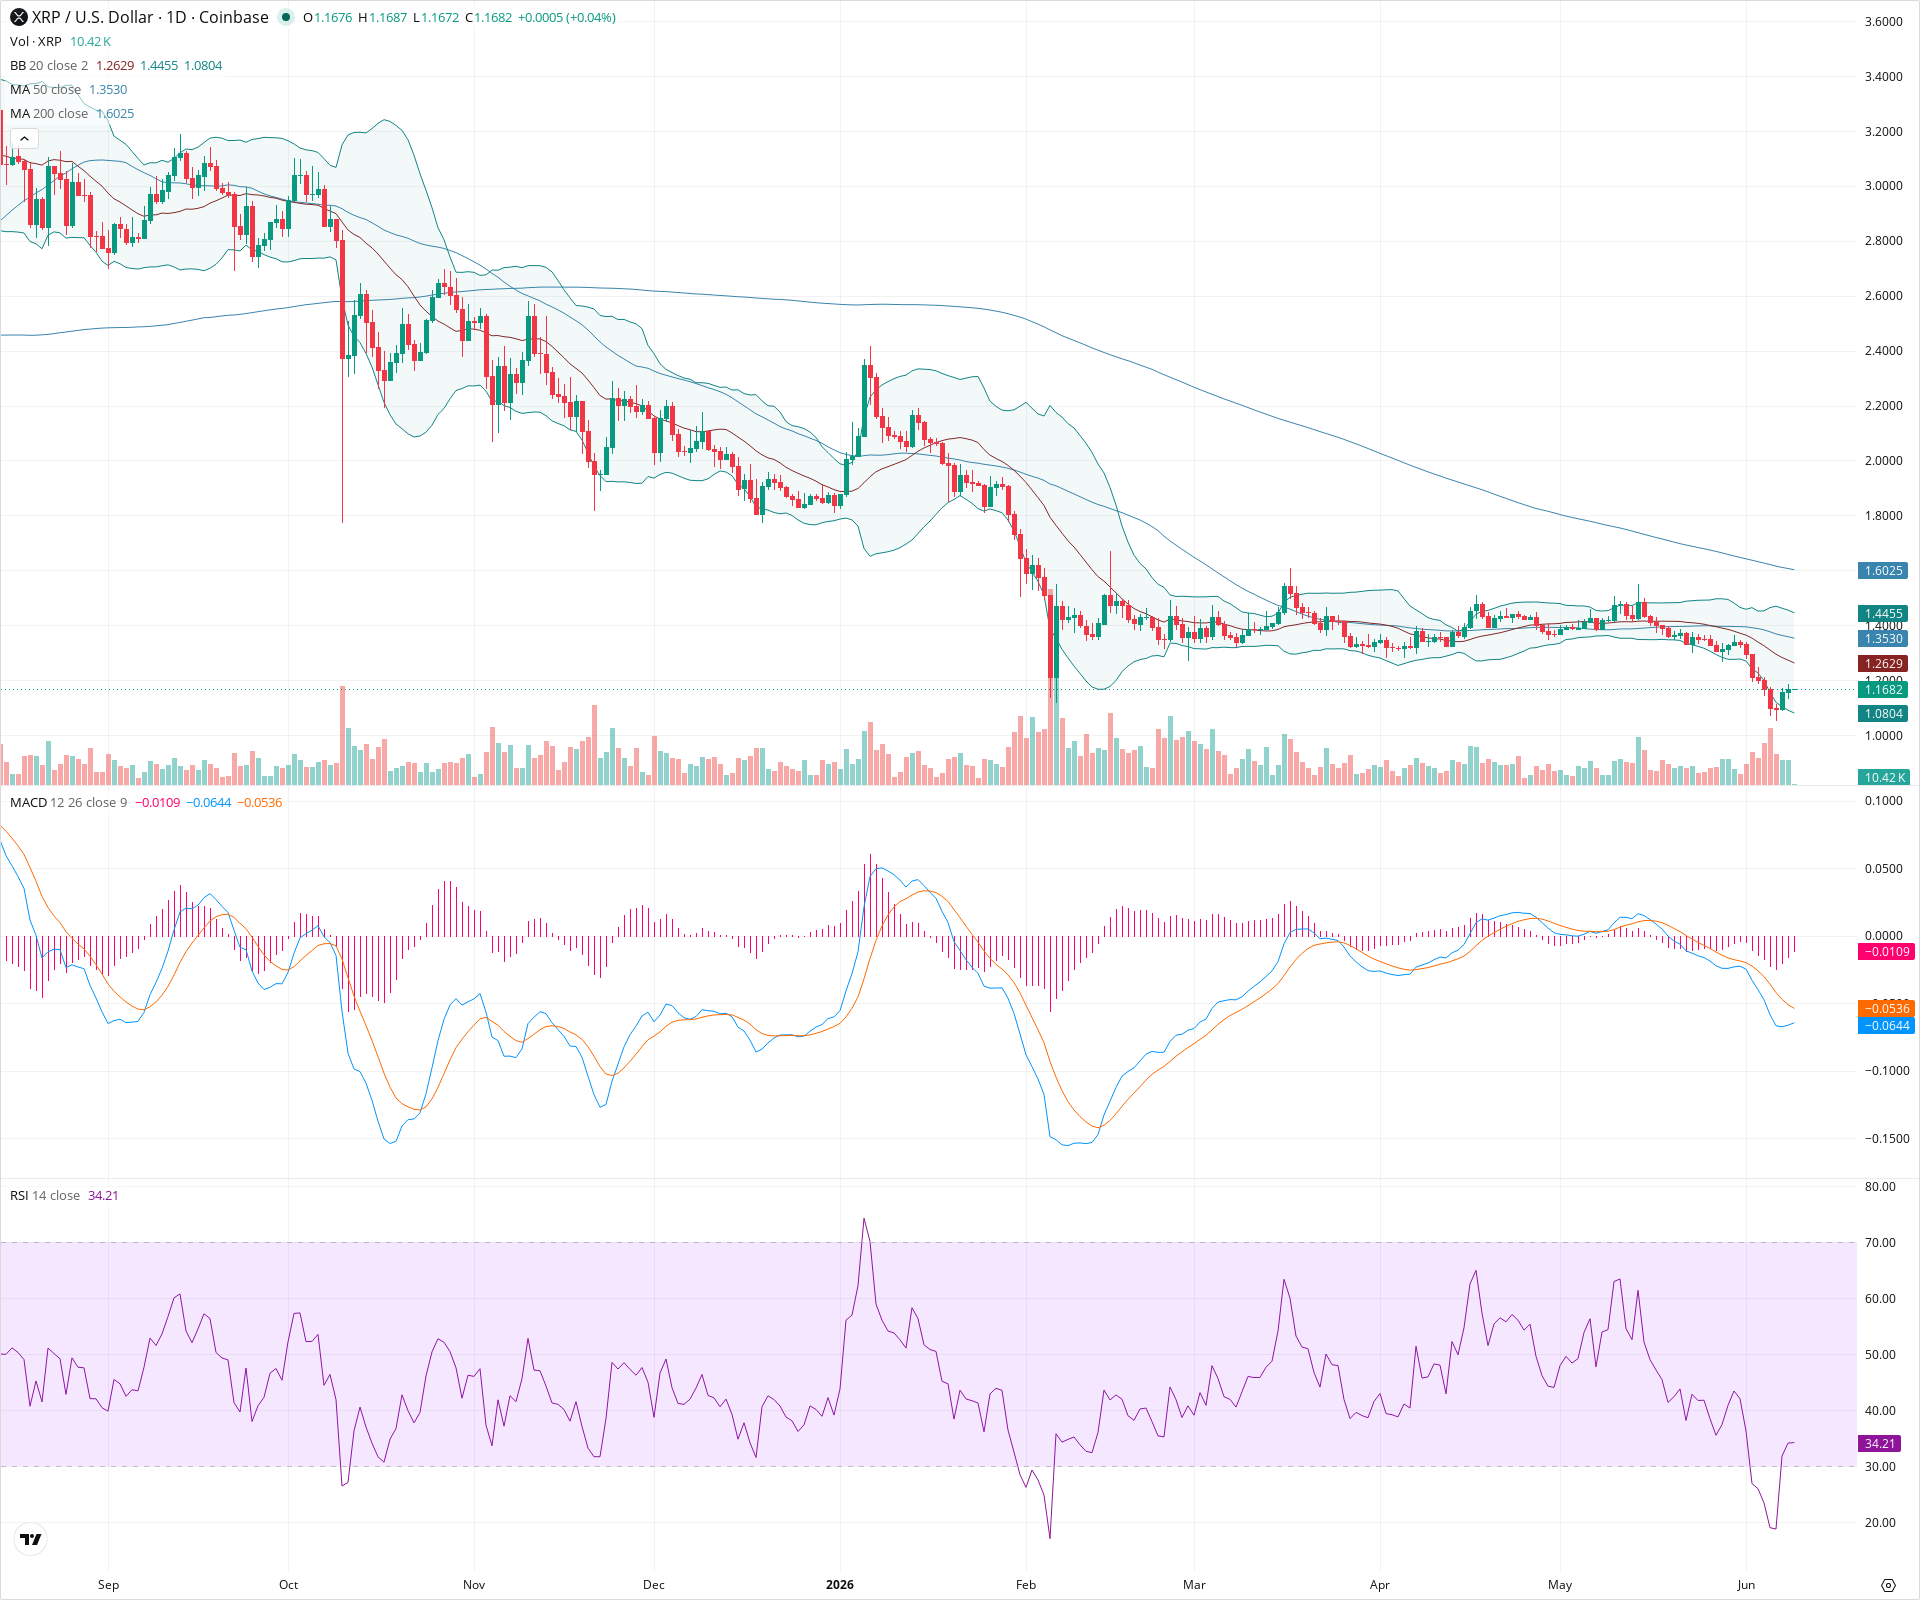
XRP is firmly entrenched in a long-term downtrend, consistently trading below all major moving averages. Although short-term indicators like the RSI are hovering near oversold territory, the prevailing momentum remains bearish. Any upward movement would likely encounter significant resistance at the declining moving averages, and a substantial change in market structure is required to alter the long-term bearish outlook.
Included In Lists
Related Tickers of Interest
Historical Report Navigation
Browse adjacent archived reports or jump back to the latest live analysis page.
XRP Daily Chart
Sentiment
Short-term Sentiment (days to weeks): Bearish
Price is trading below the 20 and 50-day SMAs with strong recent downward momentum. The MACD is negative and expanding, and while the RSI is near oversold levels, a clear reversal pattern has not yet formed.
Long-term Sentiment (weeks to months): Bearish
The asset is in a pronounced, long-term downtrend characterized by lower highs and lower lows. Price remains significantly below a downward-sloping 200-day SMA.
Report Metadata
- Timeframe: daily
- Generated at: Jun 9, 2026
- Model: gemini-3.1-pro-preview
Support Price Levels
| Level | Range | Strength | Notes |
|---|---|---|---|
| $1.08 | $1.05 - $1.10 | Weak | Immediate support zone based on recent swing lows. |
| $0.95 | $0.90 - $1.00 | Strong | Major psychological round number and the lowest prominent structural support visible on the chart. |
Resistance Price Levels
| Level | Range | Strength | Notes |
|---|---|---|---|
| $1.28 | $1.25 - $1.30 | Moderate | Immediate overhead resistance zone, aligning roughly with the declining 20-day SMA. |
| $1.42 | $1.40 - $1.45 | Strong | Prior consolidation zone acting as resistance, located just above the 50-day SMA. |
| $1.63 | $1.60 - $1.65 | Strong | Major structural resistance zone aligning with the 200-day SMA. |
Potential Chart Patterns in Formation
| Strength | Pattern | Signal | Target | Details |
|---|---|---|---|---|
| Strong | Downtrend Channel | Bearish | N/A | A persistent series of lower highs and lower lows spanning the entire visible chart, with moving averages acting as dynamic resistance. |
| Weak | Potential Bear Flag | Bearish | N/A | Recent sharp downward impulse followed by a tight consolidation near the lower Bollinger Band, suggesting potential continuation of the downtrend if support breaks. |
Frequently Asked Questions about XRP
What is the current sentiment for XRP?
The short-term sentiment for XRP is currently Bearish because Price is trading below the 20 and 50-day SMAs with strong recent downward momentum. The MACD is negative and expanding, and while the RSI is near oversold levels, a clear reversal pattern has not yet formed. The long-term trend is classified as Bearish.
What are the key support levels for XRP?
StockDips.AI has identified key support levels for XRP at $1.08 and $0.95. These levels may represent potential accumulation zones where buying interest could emerge.
Is XRP in a significant dip or a Value Dip right now?
XRP has a Value Score of 84/100. It is currently flagged as a significant dip in the Top Dips list. It is not listed as a Value Dip because the long-term sentiment or value-score threshold does not qualify.
View the full interactive analysis on StockDips.AI.