TLT Daily Technical Analysis
20+ Year Treasury Bond ETF
iShares 20+ Year Treasury Bond ETF - Invests in U.S. Treasury bonds with maturities of 20 years or more, often used for stability.
This is a historical daily technical analysis report for TLT, generated on June 2, 2026 at 2:04 PM UTC.
TLT Technical Analysis Summary
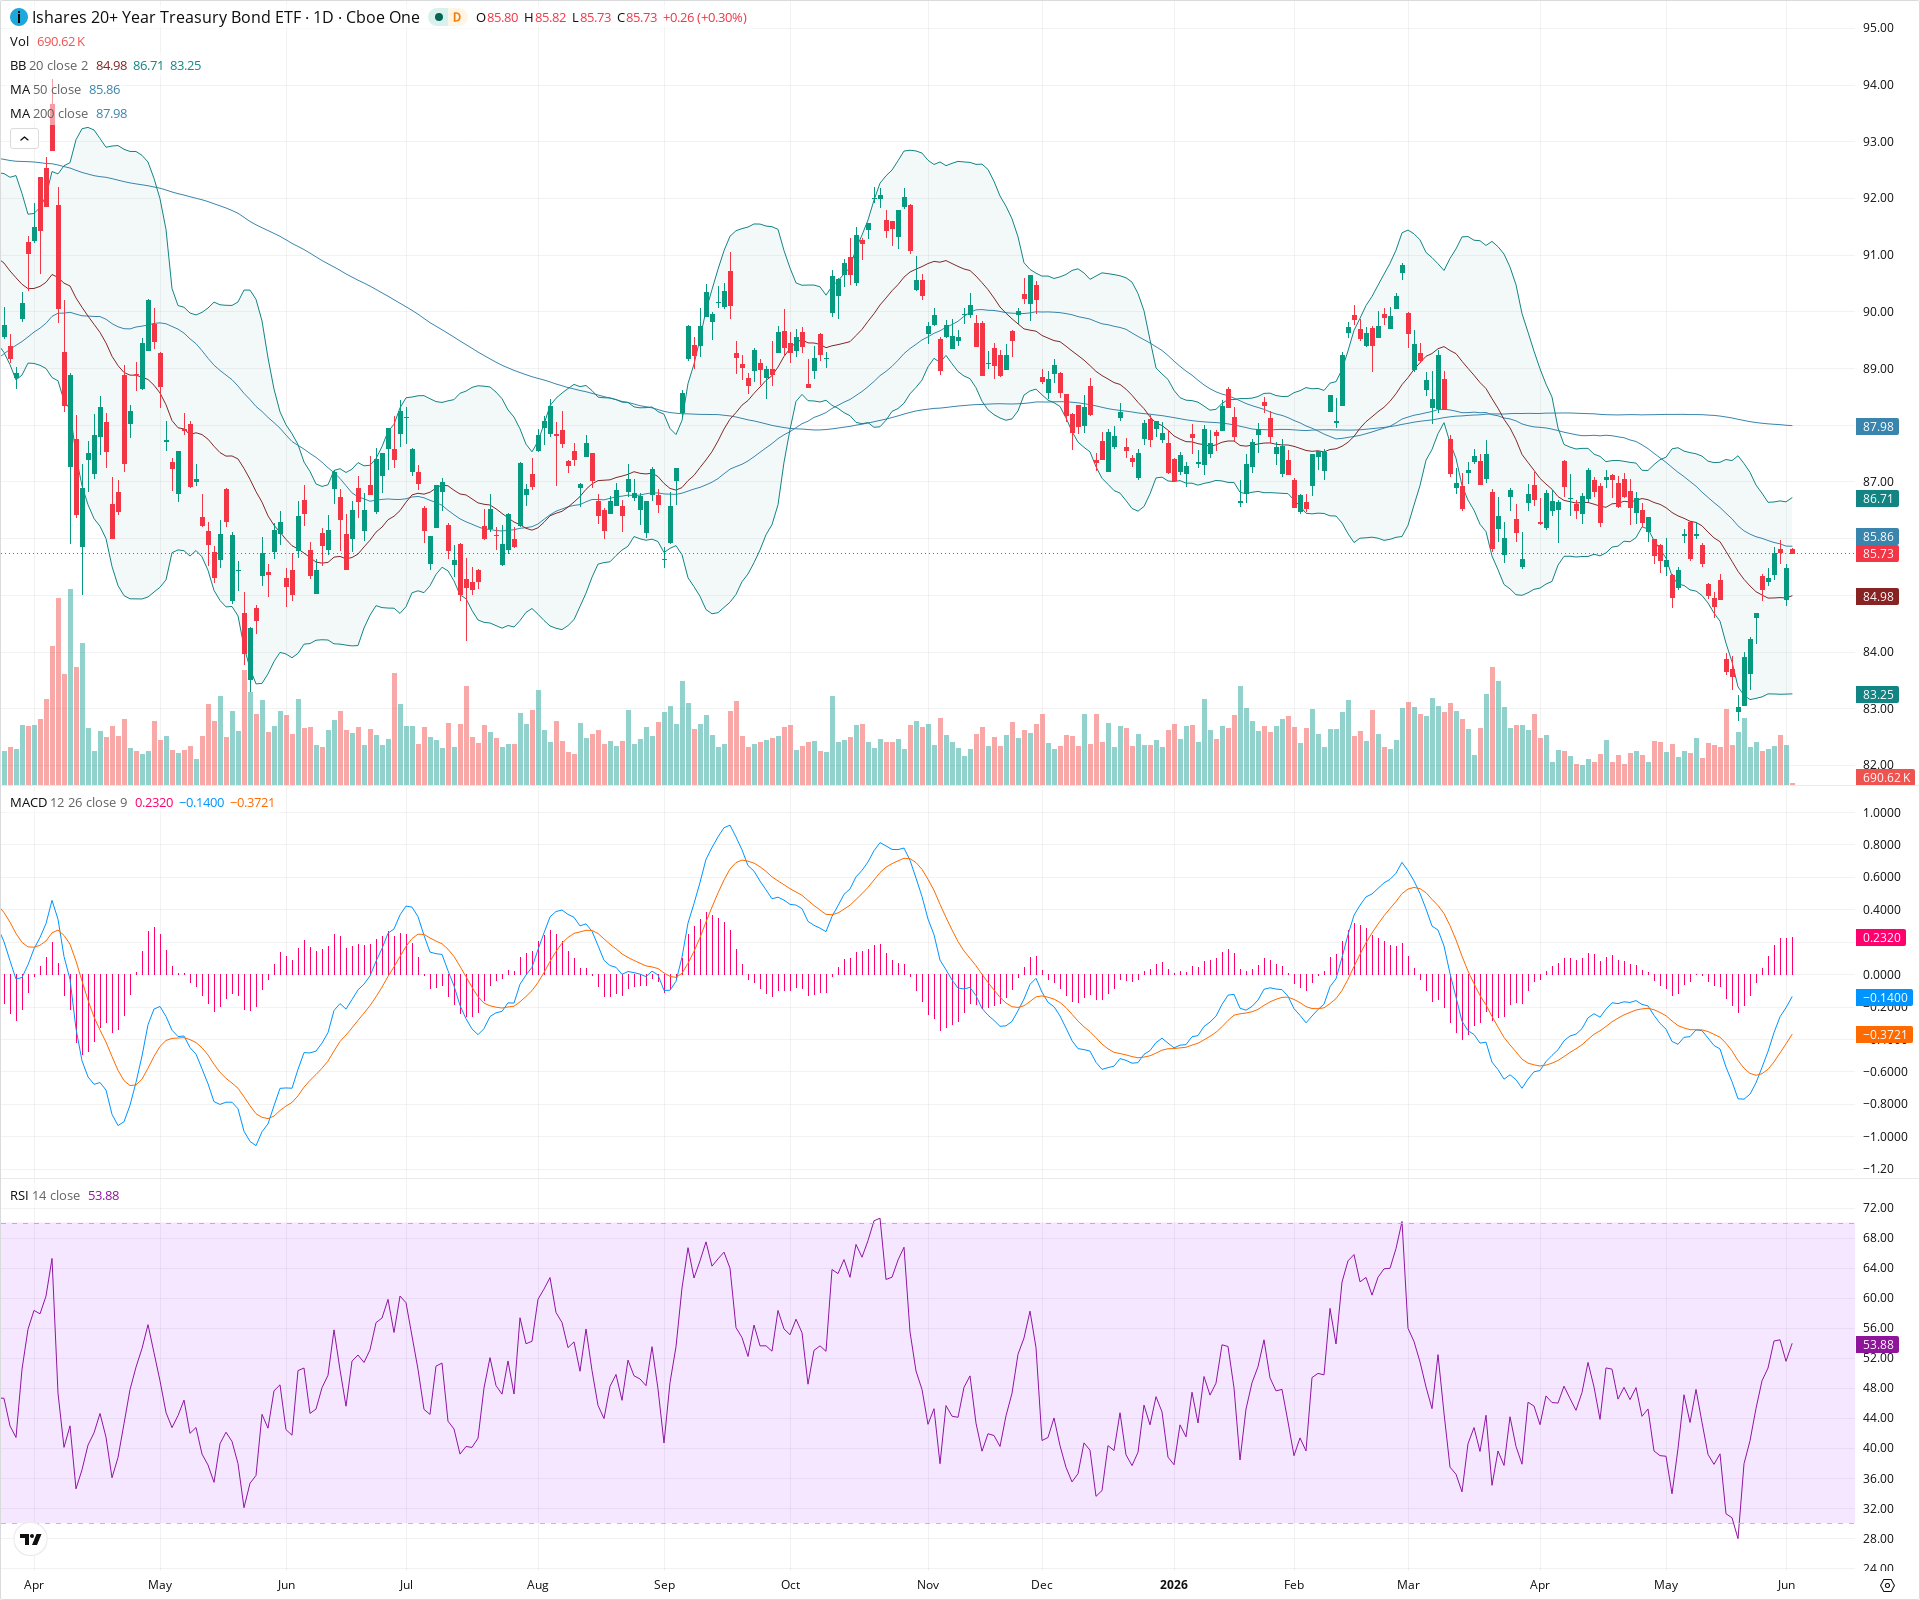
The asset is entrenched in a clear long-term downtrend, indicated by consistent lower highs and price positioning below key moving averages. However, a sharp rejection of recent lows has sparked a vigorous short-term counter-trend rally, backed by bullish shifts in momentum indicators. To suggest a more durable trend change, price will first need to clear the immediate hurdle of the 50-day moving average.
Included In Lists
Related Tickers of Interest
Historical Report Navigation
Browse adjacent archived reports or jump back to the latest live analysis page.
TLT Daily Chart
Sentiment
Short-term Sentiment (days to weeks): Bullish
Price has strongly rebounded from recent lows, breaking above the 20-day SMA. This upward move is confirmed by a bullish MACD crossover with an expanding positive histogram, and RSI recovering from deeply oversold levels to a neutral, rising stance.
Long-term Sentiment (weeks to months): Bearish
The broader visual trend consists of a series of lower highs and lower lows over several months. Additionally, price is trading underneath a downward-sloping 200-day SMA and is currently encountering resistance at the 50-day SMA.
Report Metadata
- Timeframe: daily
- Generated at: Jun 2, 2026
- Model: gemini-3.1-pro-preview
Support Price Levels
| Level | Range | Strength | Notes |
|---|---|---|---|
| $84.75 | $84.50 - $85.00 | Weak | Dynamic support area around the 20-day moving average. |
| $82.25 | $82.00 - $82.50 | Strong | Recent major swing low that acted as a strong rejection point with notable volume, halting the previous steep decline. |
Resistance Price Levels
| Level | Range | Strength | Notes |
|---|---|---|---|
| $86.28 | $85.80 - $86.75 | Strong | Immediate resistance zone encompassing the downward-sloping 50-day SMA and the upper Bollinger Band. |
| $88.00 | $87.50 - $88.50 | Strong | Significant overhead resistance consisting of the 200-day SMA and a prior structural consolidation zone from earlier in the year. |
Potential Chart Patterns in Formation
| Strength | Pattern | Signal | Target | Details |
|---|---|---|---|---|
| Strong | Descending Channel (Implied) | Bearish | N/A | Macro price action over the last several months fits within a broad, downward-sloping channel characterized by lower highs and lower lows. The recent bounce originated near the implied lower boundary of this structure. |
Frequently Asked Questions about TLT
What is the current sentiment for TLT?
The short-term sentiment for TLT is currently Bullish because Price has strongly rebounded from recent lows, breaking above the 20-day SMA. This upward move is confirmed by a bullish MACD crossover with an expanding positive histogram, and RSI recovering from deeply oversold levels to a neutral, rising stance. The long-term trend is classified as Bearish.
What are the key support levels for TLT?
StockDips.AI has identified key support levels for TLT at $84.75 and $82.25. These levels may represent potential accumulation zones where buying interest could emerge.
Is TLT in a significant dip or a Value Dip right now?
TLT has a Value Score of 42/100. It is not currently flagged as a significant dip in the Top Dips list. It is not listed as a Value Dip because the long-term sentiment or value-score threshold does not qualify.
View the full interactive analysis on StockDips.AI.